
In This Article
- Entering Edit Mode
- Adding Widgets
- Moving and Arranging Widgets
- Resizing Widgets
- Removing Widgets
- Saving Your Layout
Overview
The Idea/Initiative Performance page displays a summary of the key performance areas of your Idea or Initiative using a configurable dashboard-style layout. You can customize this page by adding, removing, moving, and arranging widgets to create a view that best suits your needs.
The layout you configure is saved per Initiative, meaning all users with access to that Initiative will see the same widget arrangement. Existing Initiatives retain their current page layout as the default until you choose to edit it.
Widgets can be added manually through the Add New Widget menu or automatically when linked through the Value Driver Tree (VDT). When VDT-driven widgets are added automatically, they are placed at the bottom of your existing layout, preserving any customizations you have made.
Editing the Dashboard Layout
You can customize the Performance page layout to show only the widgets and information most relevant to your Initiative.
Entering Edit Mode
To edit the dashboard layout:
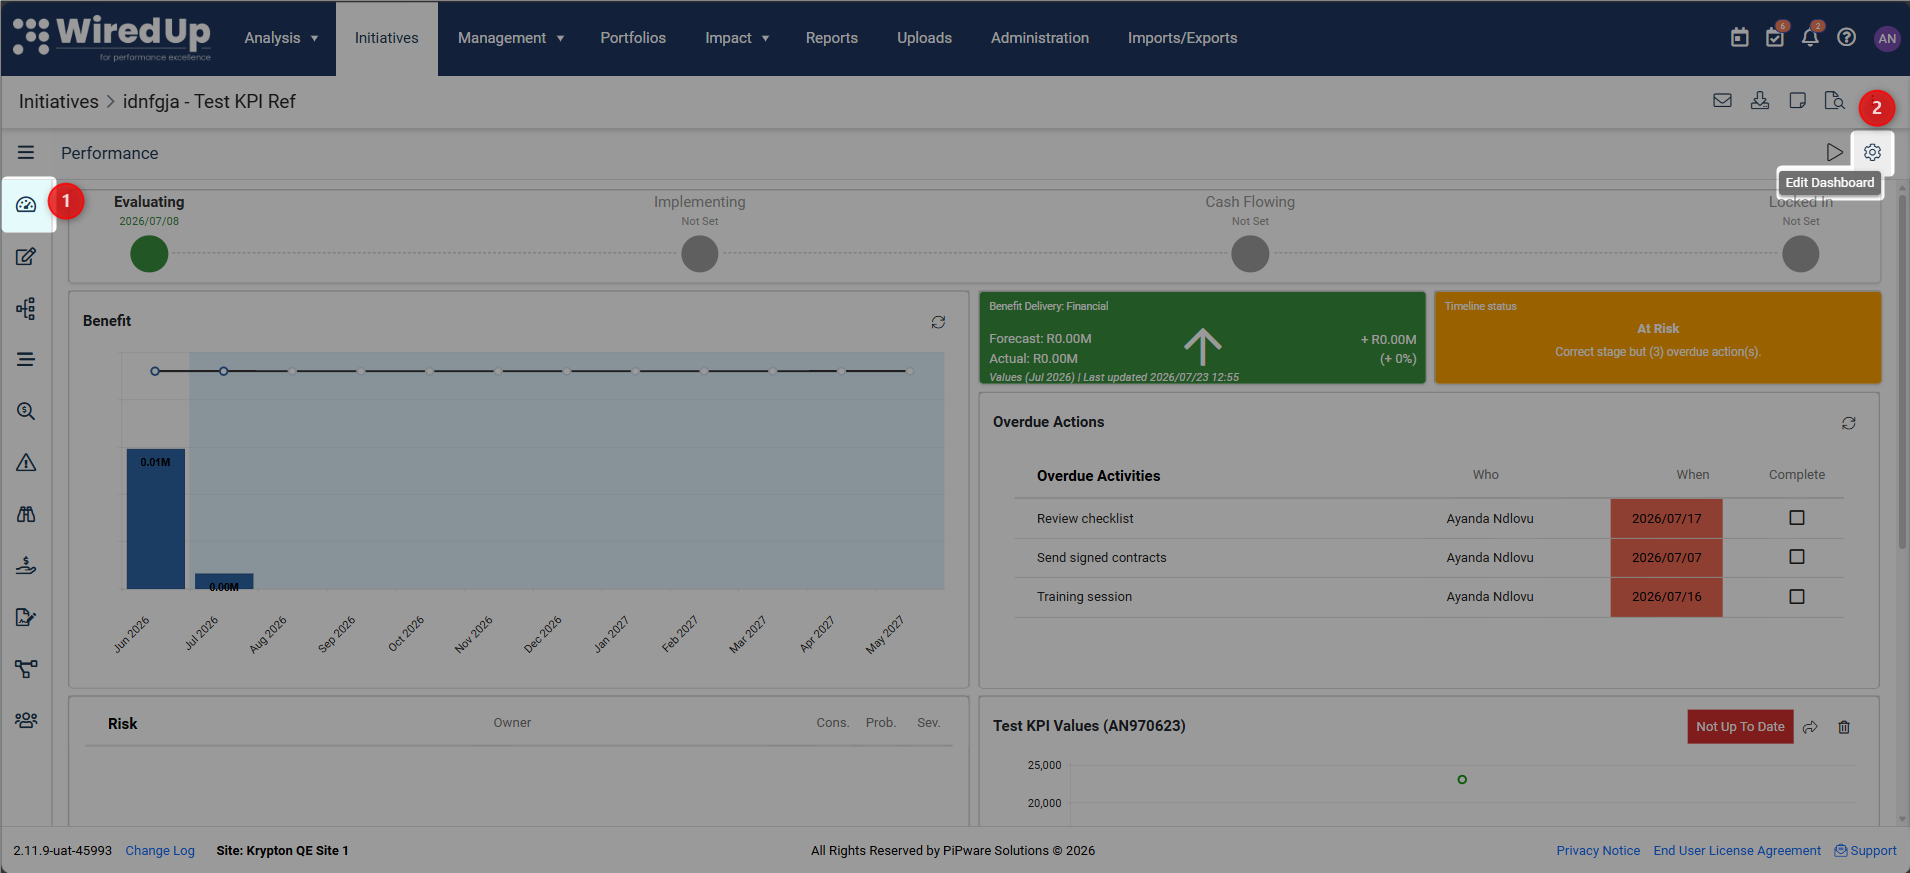
- Navigate to the Performance page of your Idea/Initiative
- Click the cog icon on the Function Bar at the top of the page
The page will enter edit mode, allowing you to add, move, resize, and remove widgets.
Adding Widgets
To add a new widget to your Performance page:
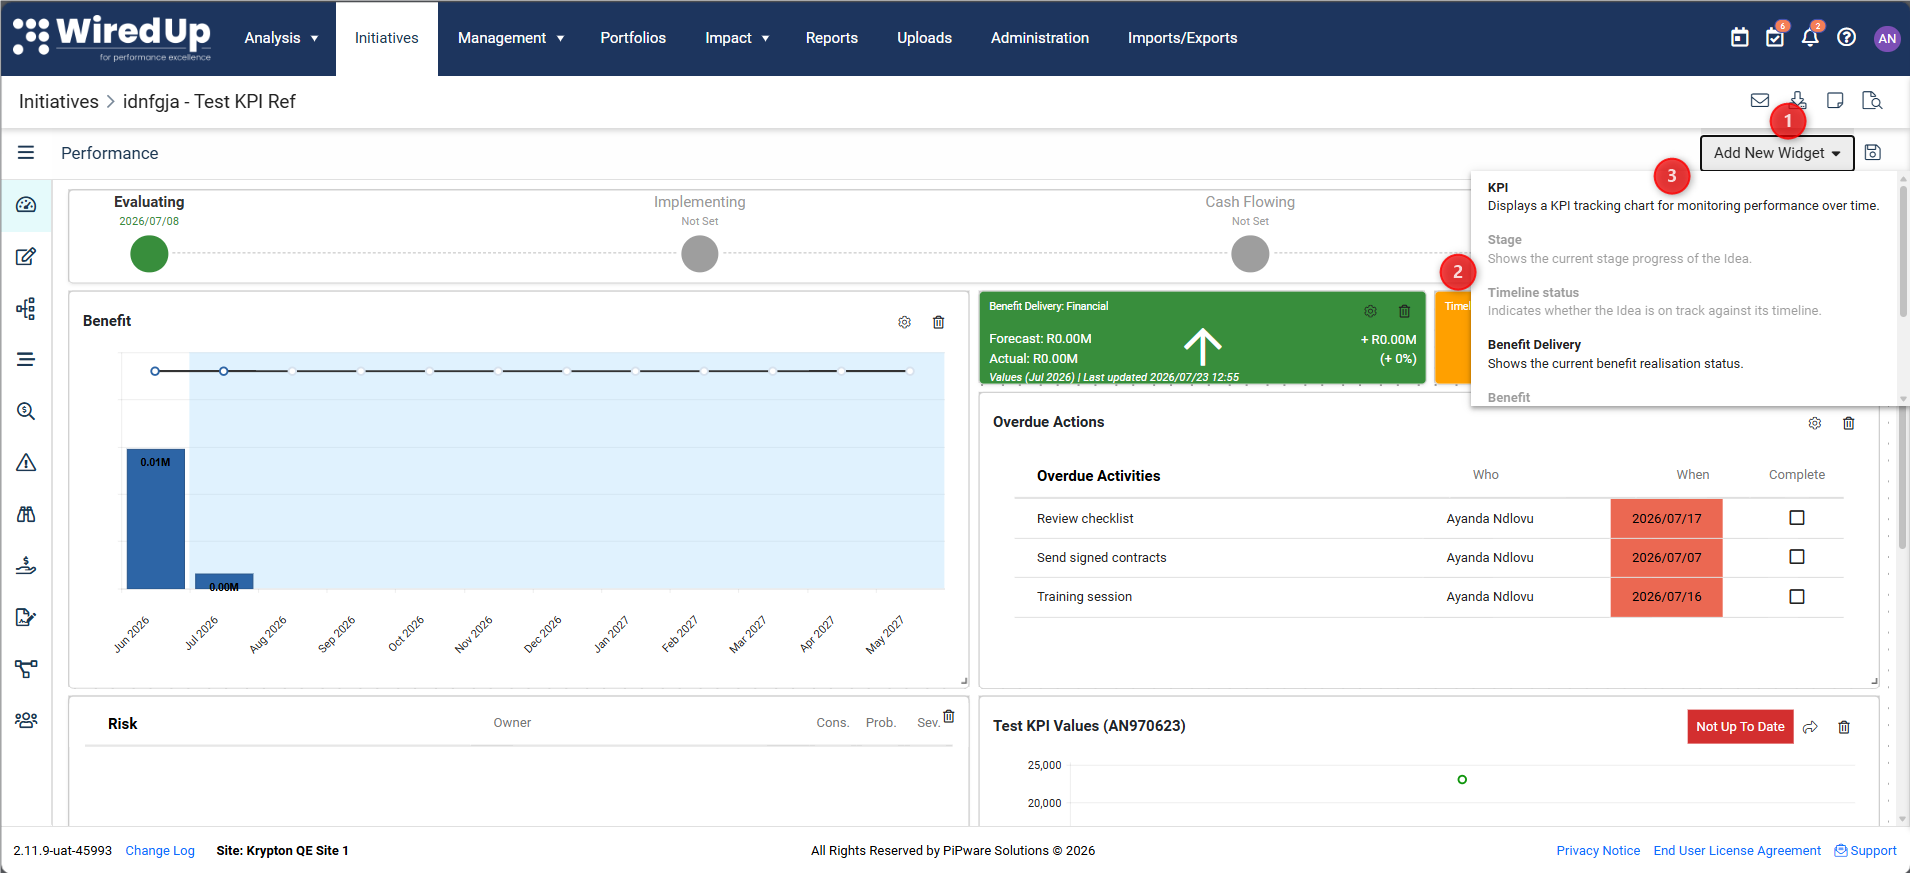
- While in edit mode, click the Add New Widget button
- The widget menu will open, displaying all available widget types with their Name and Description
- Select the widget you want to add
- The widget will be added to your layout and can then be positioned as needed
The available widgets are filtered based on what is relevant for your specific Initiative (for example, only benefit types configured on your Initiative will appear in the Benefit Delivery options).
Moving and Arranging Widgets
To reposition widgets on your Performance page:
- While in edit mode, click and hold on a widget
- Drag the widget to your desired position
- Release to place the widget in the new location
The dashboard uses a flexible grid layout similar to the Dashboard > Edit experience, allowing you to arrange widgets in the way that works best for you.
Resizing Widgets
Most widgets can be resized to fit your preferred layout. To resize a widget:
- While in edit mode, hover over the edge or corner of the widget
- Click and drag to adjust the size
- Release when you have reached your desired dimensions
Note: Some widgets have fixed sizes and cannot be resized:
- Timeline Status
- Benefit Delivery
- Idea/Initiative Stage indicator
Removing Widgets
To remove a widget from your Performance page:
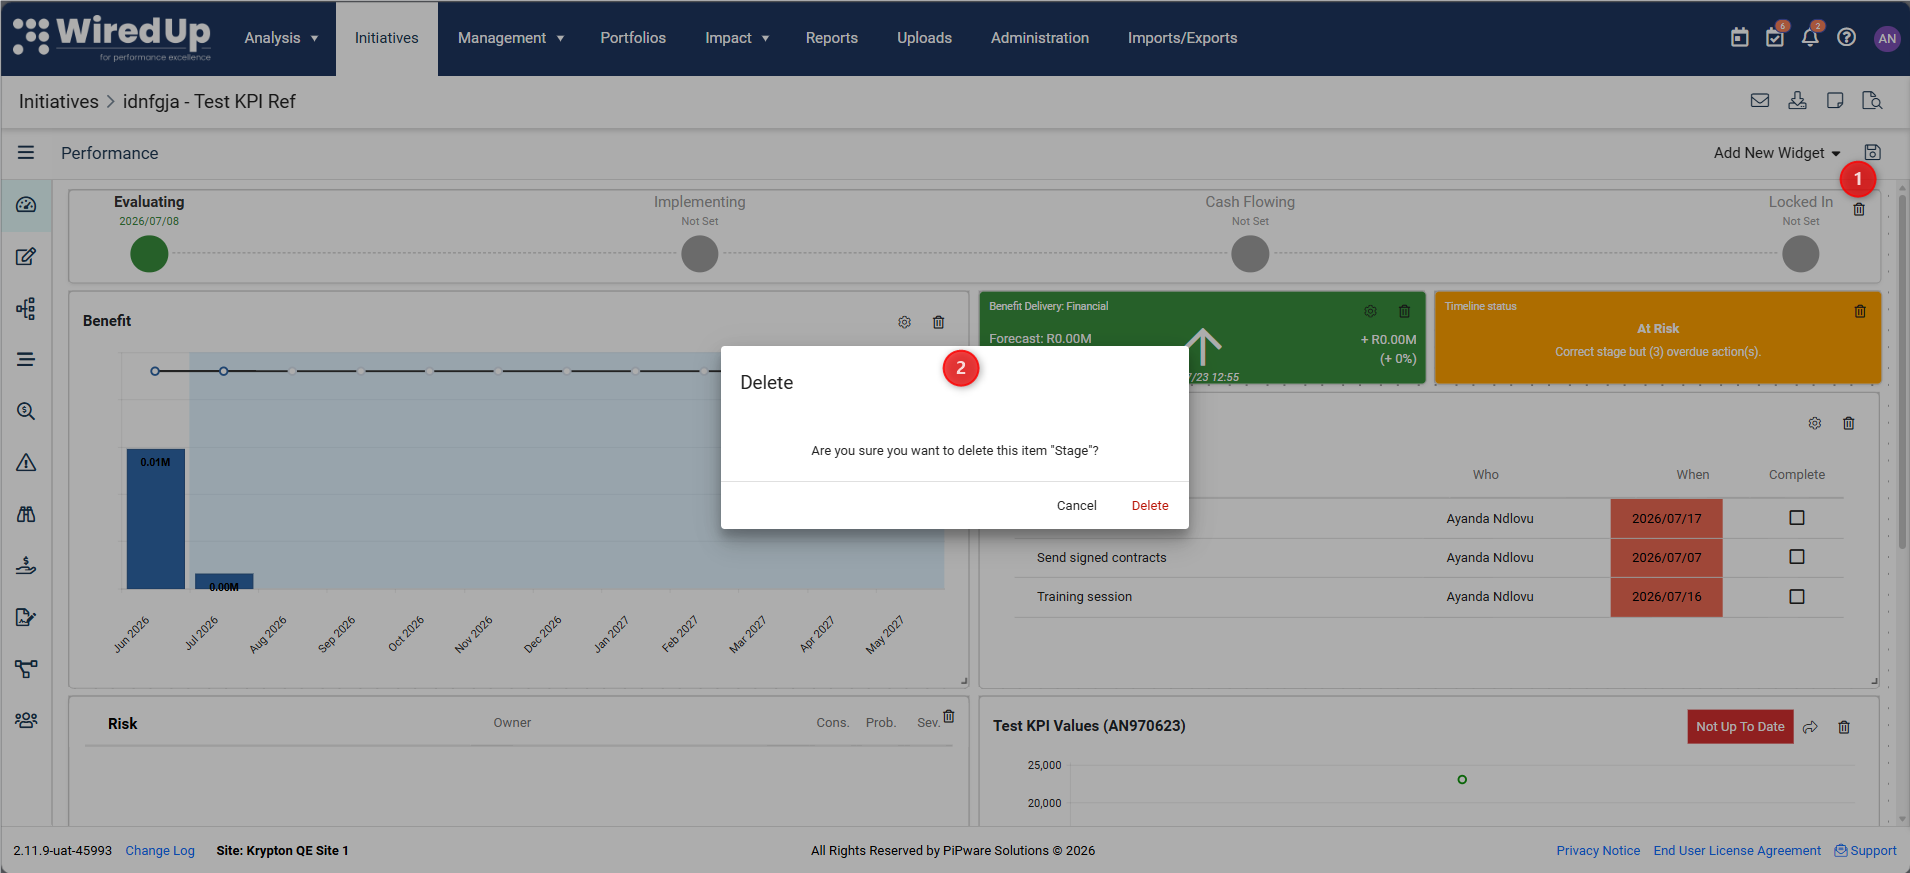
- While in edit mode, click the trash icon or remove button on the widget
- A confirmation message will be displayed to confirm the deletion of the widget
Important: The Performance page must contain at least one widget. If you attempt to remove the last remaining widget, the removal will be blocked and you will see the following message:

Header: At Least One Widget Required
Content: The Initiative Performance page must contain at least one widget. Remove action is not available until another widget is added.
Saving Your Layout
To save your changes:
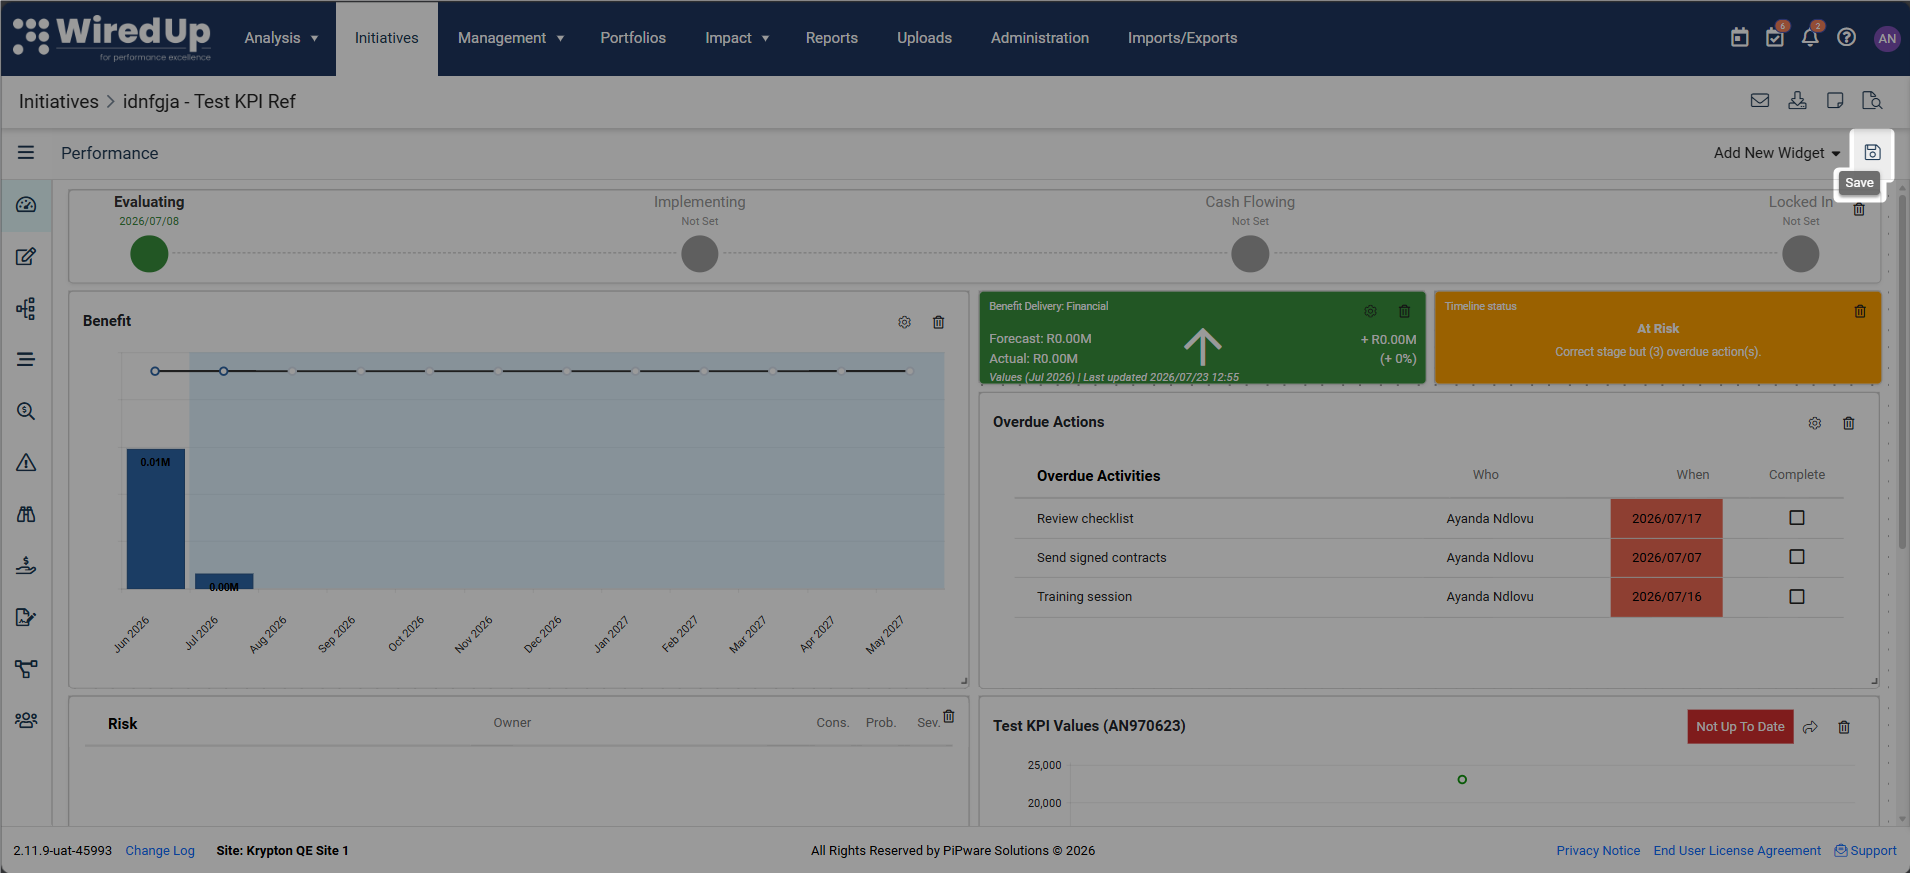
- Click the Save button while in edit mode
- Your layout configuration is saved against the Initiative
- All users with access to this Initiative will see the same layout
The layout is not user-specific. Any user with permission to edit the Initiative Performance page can modify the widget arrangement, and those changes will be visible to everyone.
Available Widgets
The Performance page supports the following widget types. You can add these manually through the Add New Widget menu, and some may be added automatically when configured through the Value Driver Tree (VDT).
Widget Types
- KPI Chart — Shows KPI performance over time in chart format
- Overdue Activities — Lists overdue actions from the Workplan
- Benefit Delivery — Shows benefit delivery status (Financial or Non-Financial types)
- Run Rate Benefit — Displays the run rate benefits chart
- Timeline Status — Shows whether the Initiative is on track, at risk, or off track
- Risks — Displays identified risks with their ratings
- Stage - shows the current stage of the idea/initiative
VDT Auto-Add Behavior
Widgets (KPI and Benefit Delivery widgets) that are driven by the Value Driver Tree (VDT) continue to be added automatically when relevant VDT changes occur:
- When a VDT-driven widget is added automatically, it is placed at the bottom of your existing layout
- Your existing widget positions and custom layout remain unchanged
- This ensures that VDT automation works seamlessly without disrupting your customizations
VDT Removal Behavior
If a VDT-driven widget is no longer valid because the corresponding VDT element has been removed:
- That widget is automatically removed from the Initiative Performance page
- The remaining widgets keep their relative layout and order
- No other changes are made to your custom layout
Workflow Stage
The Workflow Stage widget (also called Idea/Initiative Stage Indicator) displays the current stage of the Idea/Initiative, whether it is on track (green dot) or off track (red dot), and what the expected dates for entering each of the stages are. These dates are configured in the Workplan.
Click on the widget to navigate to the Approval page of the Idea/Initiative.
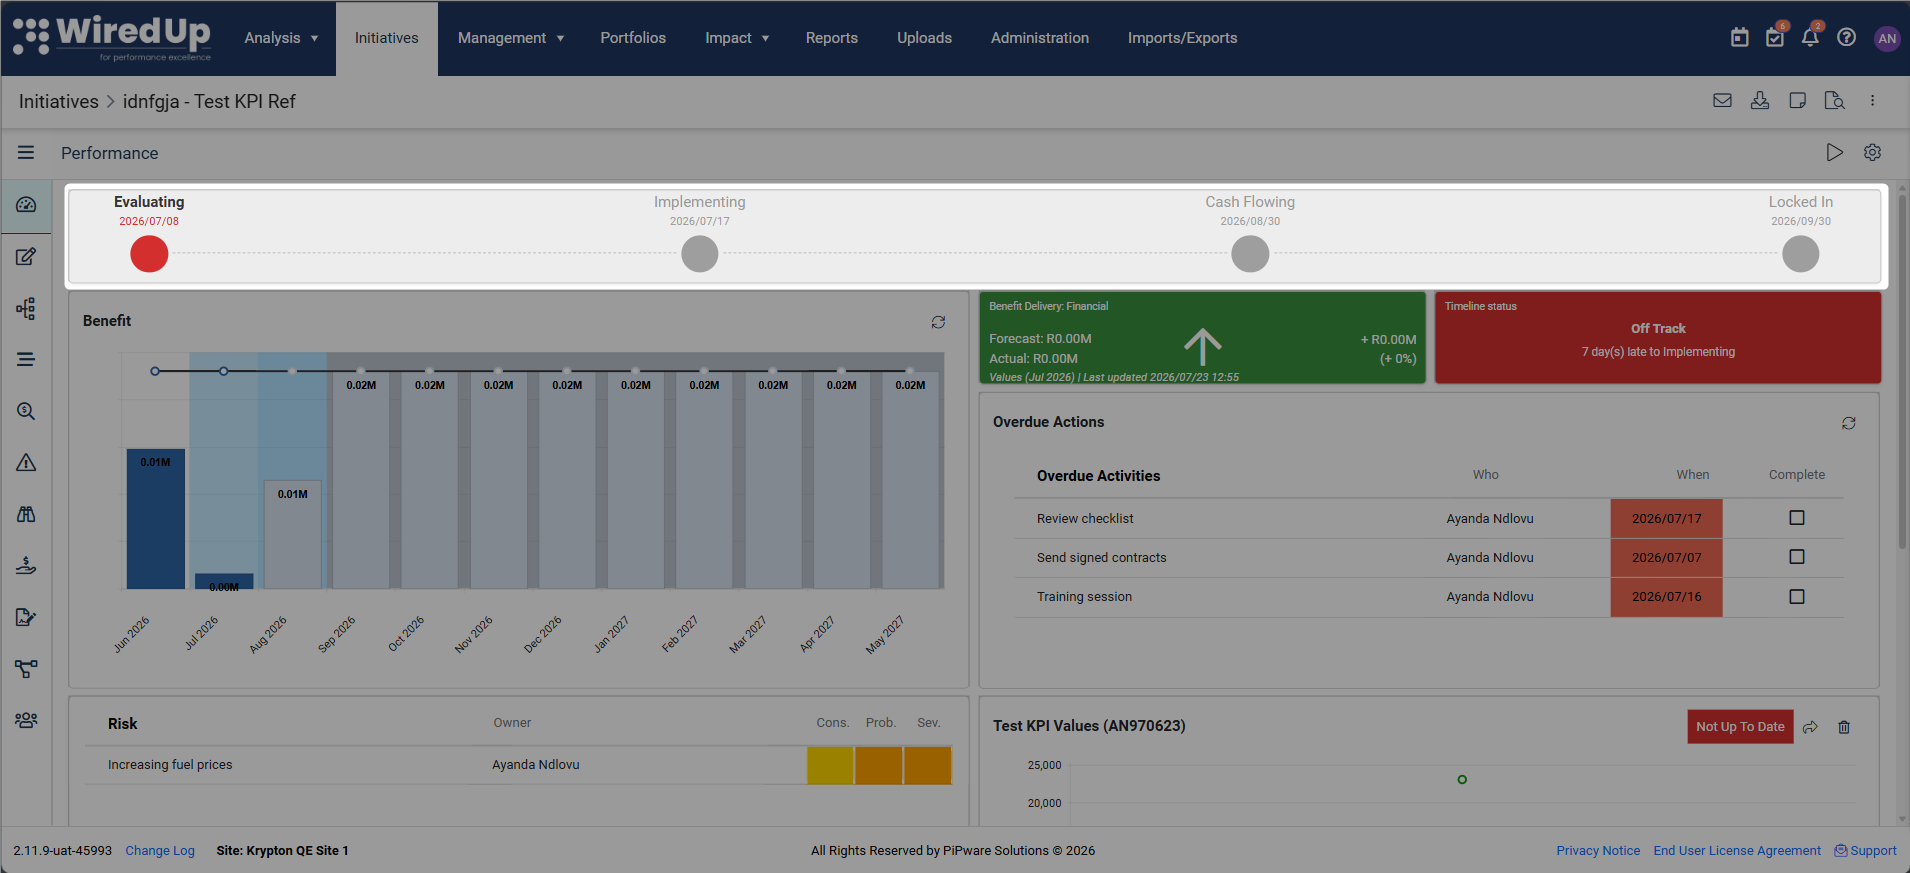
Note: This widget has a fixed size and cannot be resized within the dashboard layout.
Status Widgets
Benefits Delivery
The Benefits Delivery widget summarizes the benefits delivered/forecasted for the Idea/Initiative for the current month. The color (green, red, grey) is set based on the data that the widget receives:
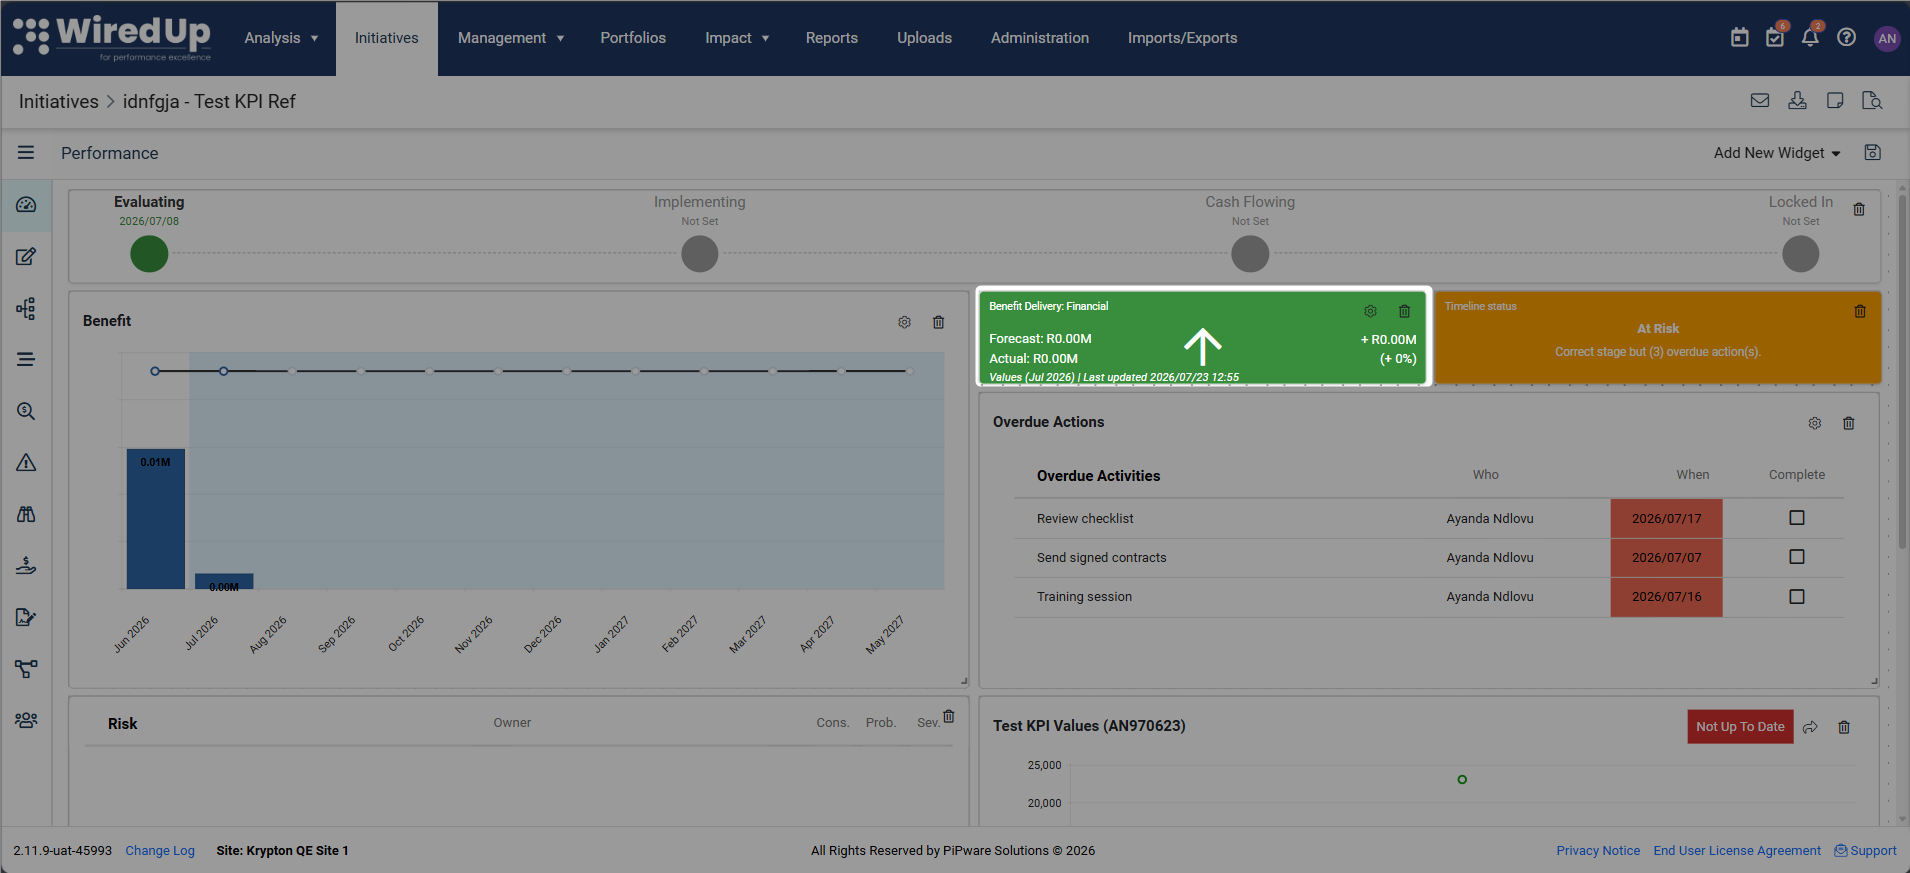
- Green — On track based on the configured trend for the Idea/Initiative
- Red — Off track based on the configured trend for the Idea/Initiative
- Grey — No data
When clicking on this widget, you will be navigated to the Initiative/Idea Overview page. If there is a warning, a triangle is shown in the widget. Hover over the icon for more information.
Benefit Types:
When you add a Benefit Delivery widget, you can configure it to display different benefit types—whether Financial or Non-Financial—that have been added to the Idea/Initiative. Each benefit type configured on your Initiative can have its own Benefit Delivery widget on the Performance page.
Note: Benefit Delivery widgets have a fixed size and cannot be resized within the dashboard layout.
Timeline Status
The Timeline Status widget displays the status of the Idea/Initiative with regard to the stage it should be in:
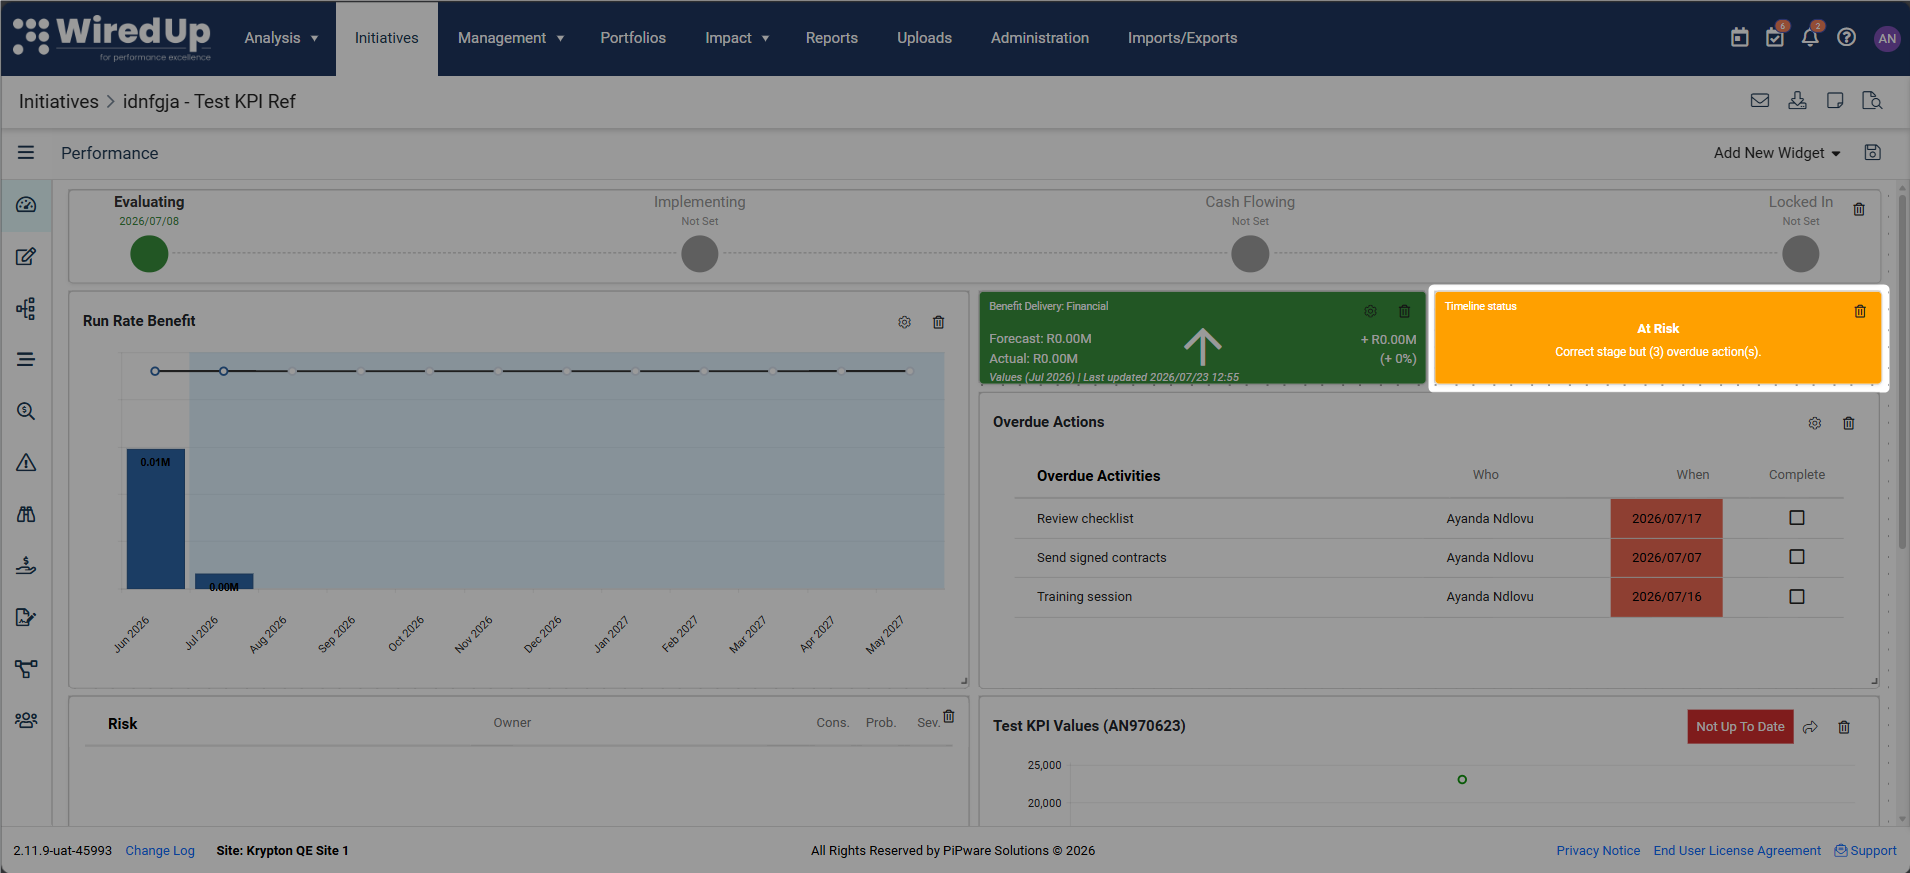
- Green — On track
- Red — Off track
- Amber — At risk
Note: This widget has a fixed size and cannot be resized within the dashboard layout.
Run Rate Benefits
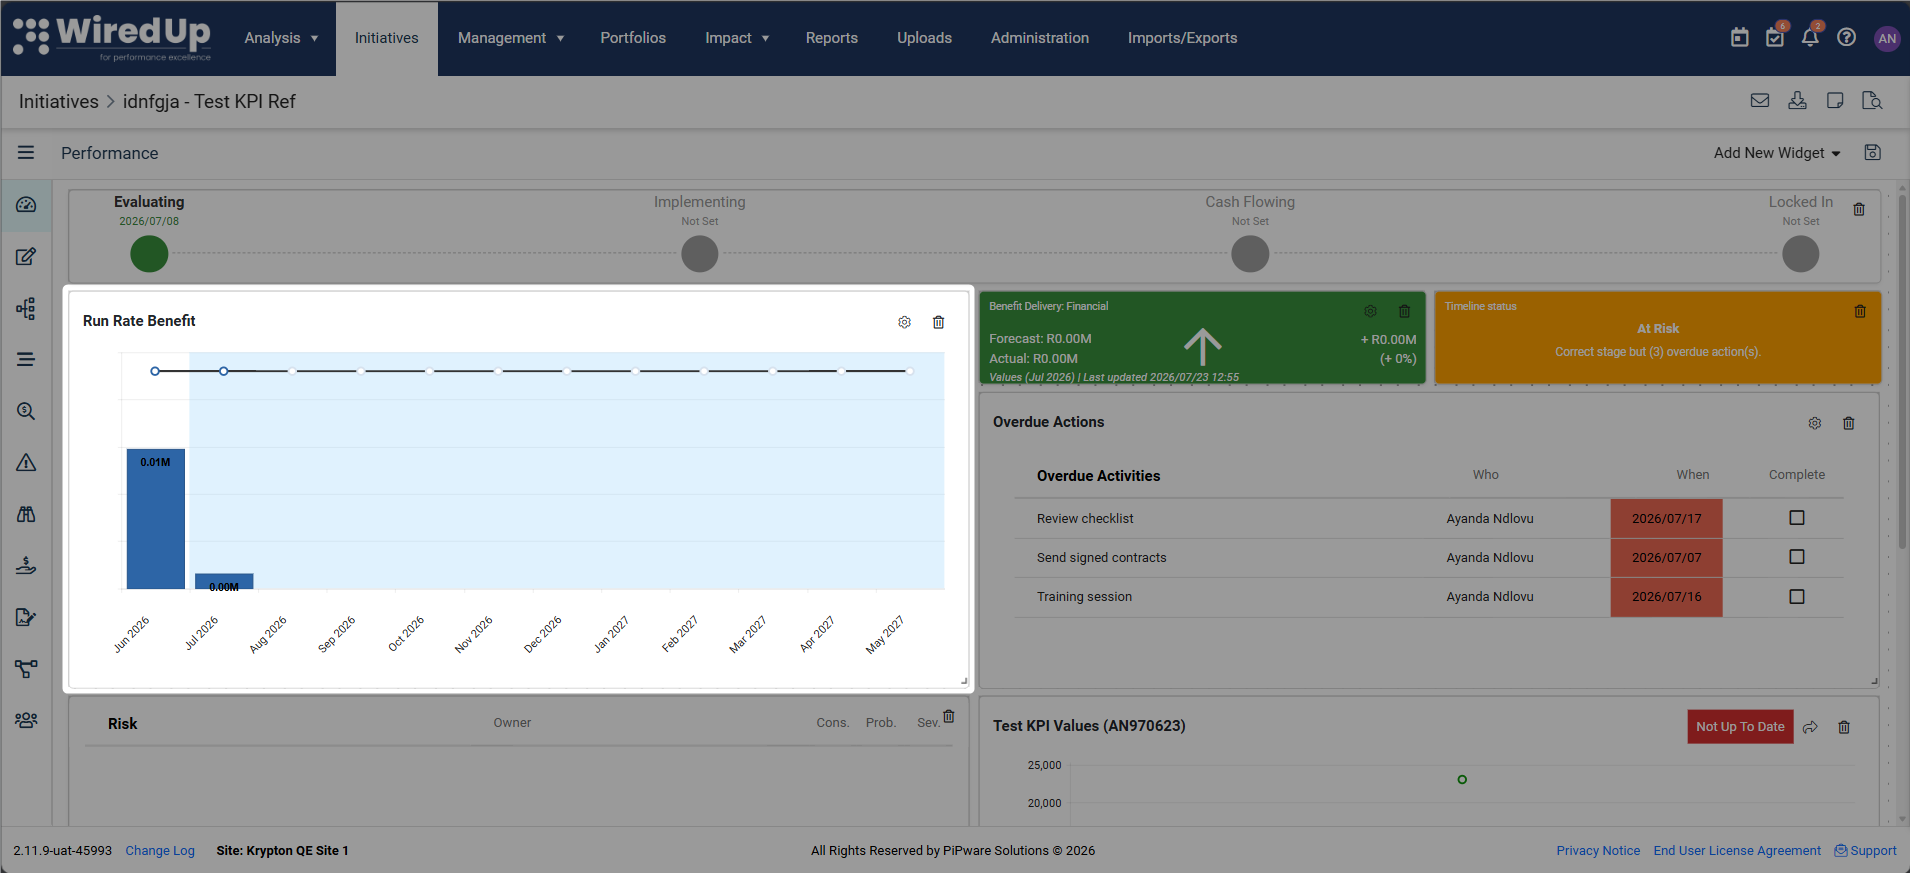
- The Run Rate Benefits widget displays a copy of the chart on the Financial Benefit page.
- Click on the widget to navigate to the Benefit page.
- This widget can be added manually via the Add New Widget menu and can be repositioned or removed from the layout as needed.
Overdue Actions
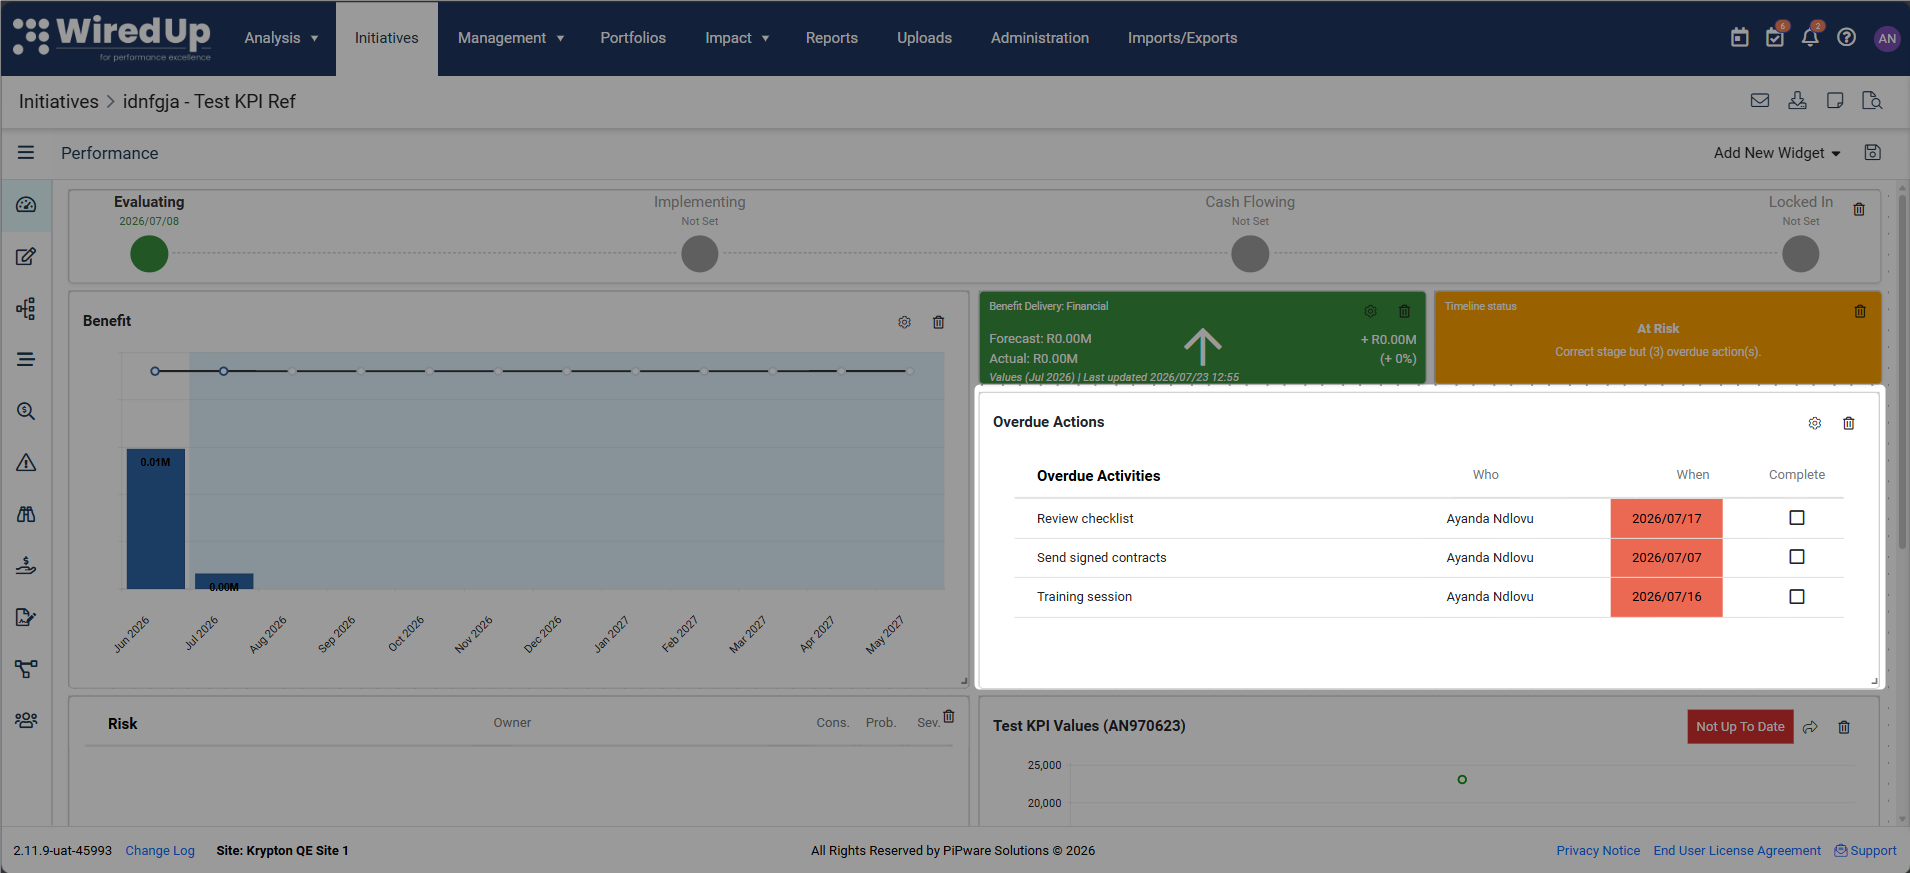
- The Overdue Activities widget shows overdue actions from the Idea/Initiative Workplan. These actions can be edited by clicking on the action name or marked as complete by ticking the checkbox.
- This widget can be added manually via the Add New Widget menu and can be repositioned or removed from the layout as needed.
Risks
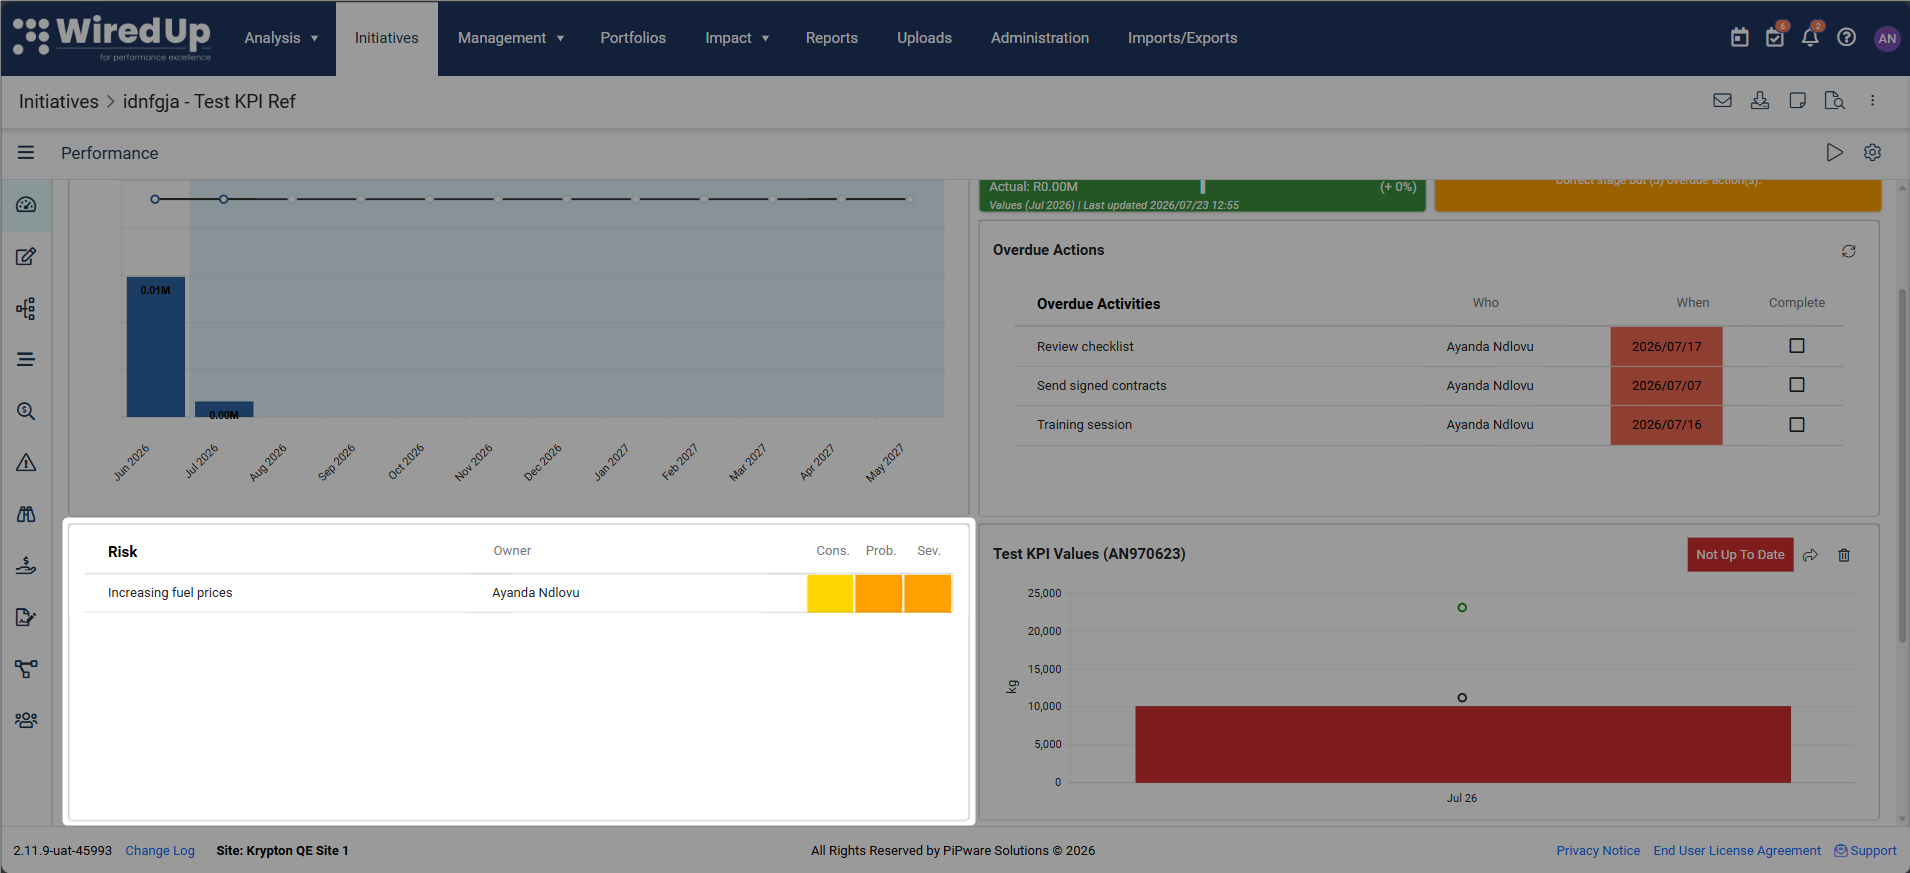
- The Risks widget shows all the risks that were identified, with the color indicating the relevant risk rating.
- Click on the widget to navigate to the Initiative/Idea Risk page.
- This widget can be added manually via the Add New Widget menu and can be repositioned or removed from the layout as needed.
KPI Chart
The KPI Chart displays KPI performance over time in chart format.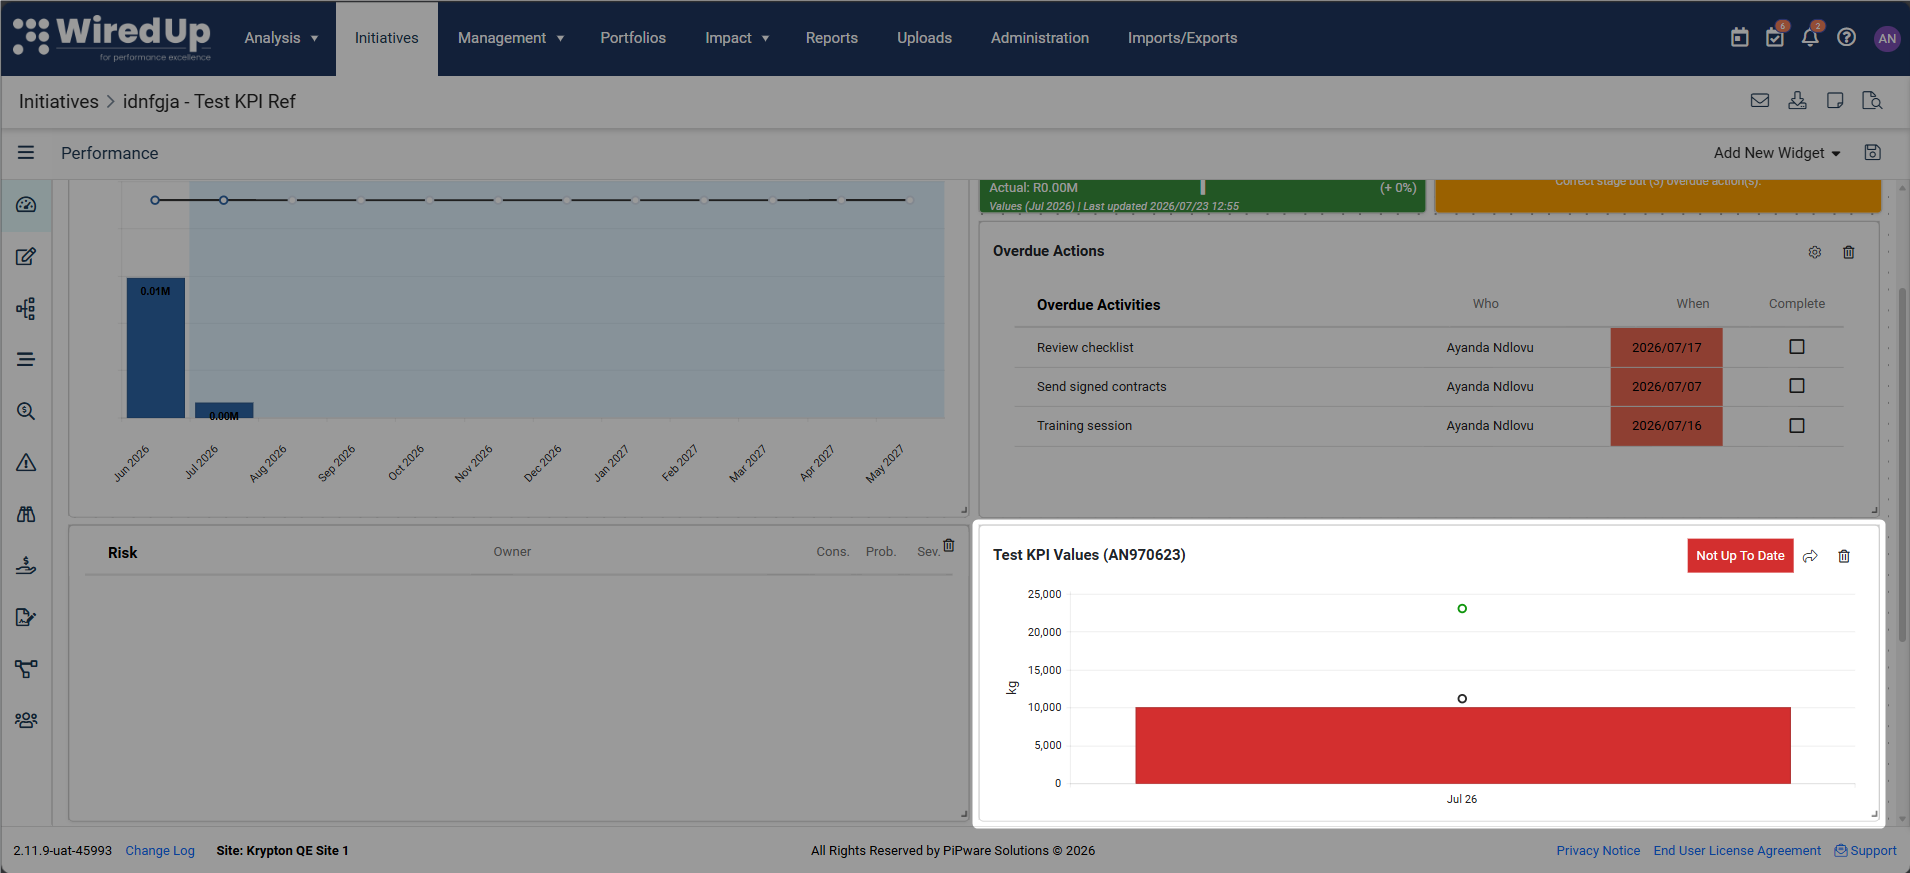
Adding KPIs
KPIs can be added to the Performance page in two ways:
- Automatically via VDT — KPIs that have been added to the Value Driver Tree will automatically appear on the Performance page. These widgets are placed at the bottom of your layout when auto-added.
- Manually — You can add additional KPI or KPI Chart widgets by clicking the Add New Widget button and selecting the desired KPI widget type.
Removing KPIs
You can remove KPI widgets from the Performance page layout:
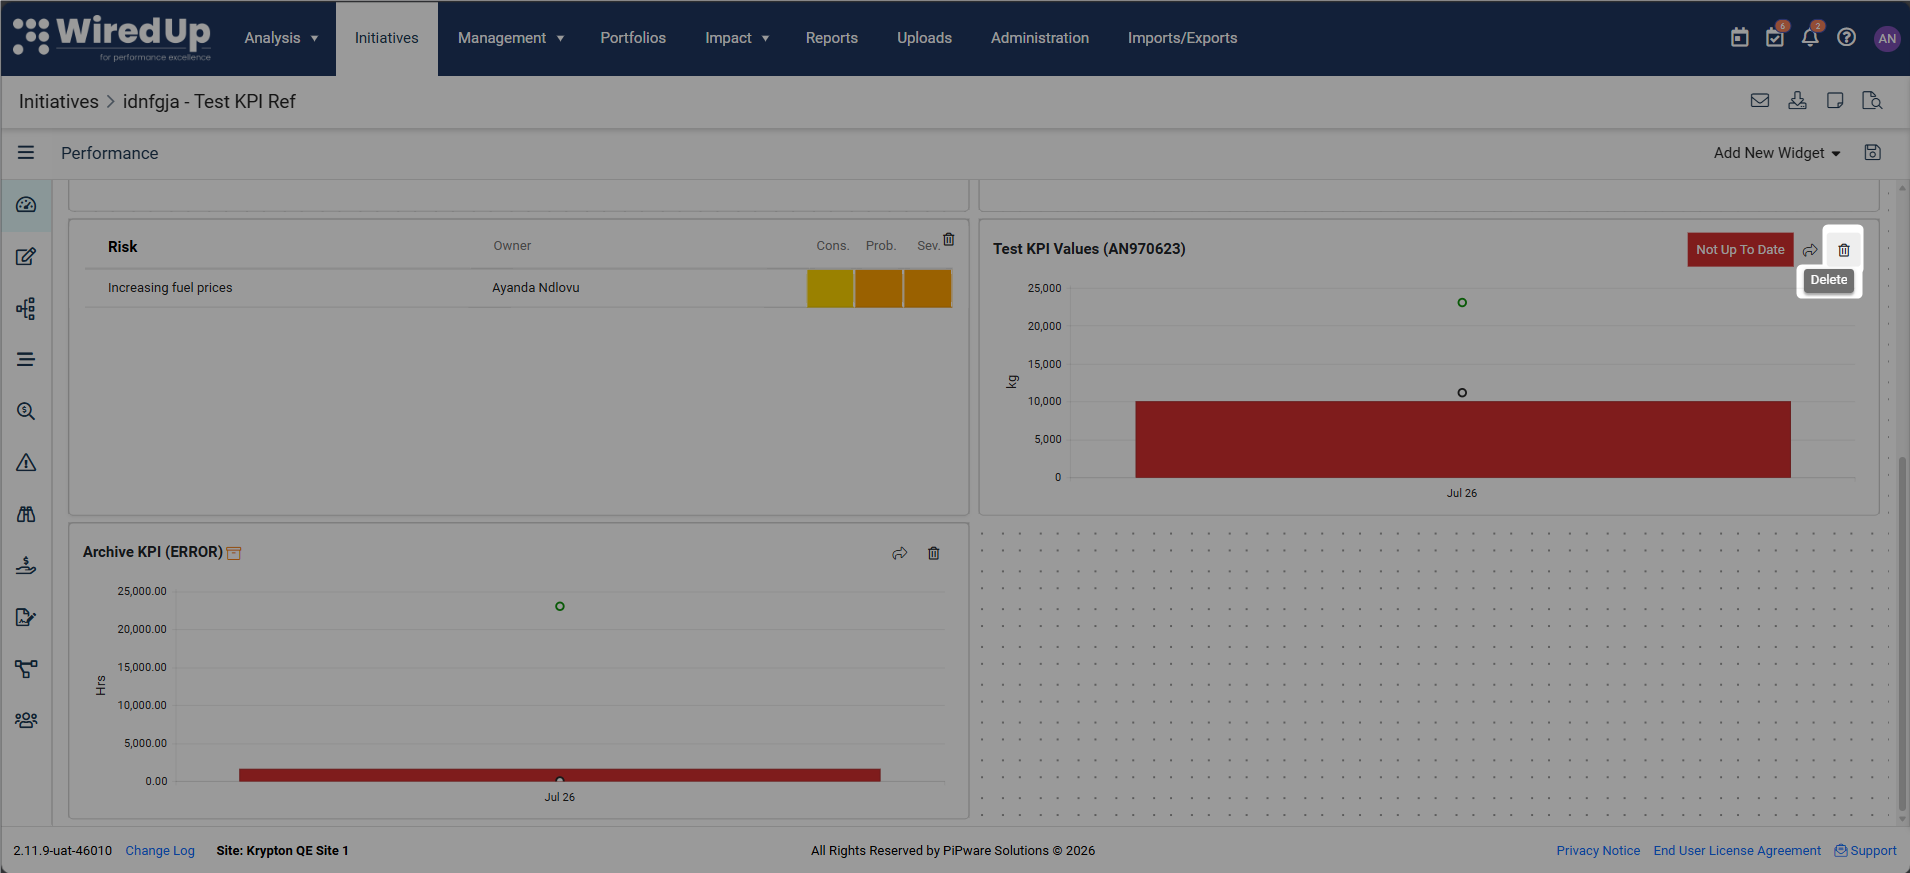
- While in edit mode, click the trash icon on the KPI widget to remove it from the layout
- This removes the widget from the Performance page view but does not delete the KPI from the Idea/Initiative
KPI Chart Date Range
The date used to generate the KPI Chart is determined as follows:
- The system will use the Implementing Stage Revised Date if specified
- If the Revised date is not specified for the Implementing Stage, the Target Date will be used
- Otherwise, if there are no Implementing Stage Target and Revised Dates specified, the chart will be generated from the date when the Idea was created
KPI Up to Date Status
The Up to Date status of the KPI is determined as follows:
- The KPI status is updated every time KPI values are uploaded or updated based on the selected performance period
- If a KPI has values uploaded for its performance period, it will be Up To Date; otherwise it will not be Up To Date
Navigating to KPI Details
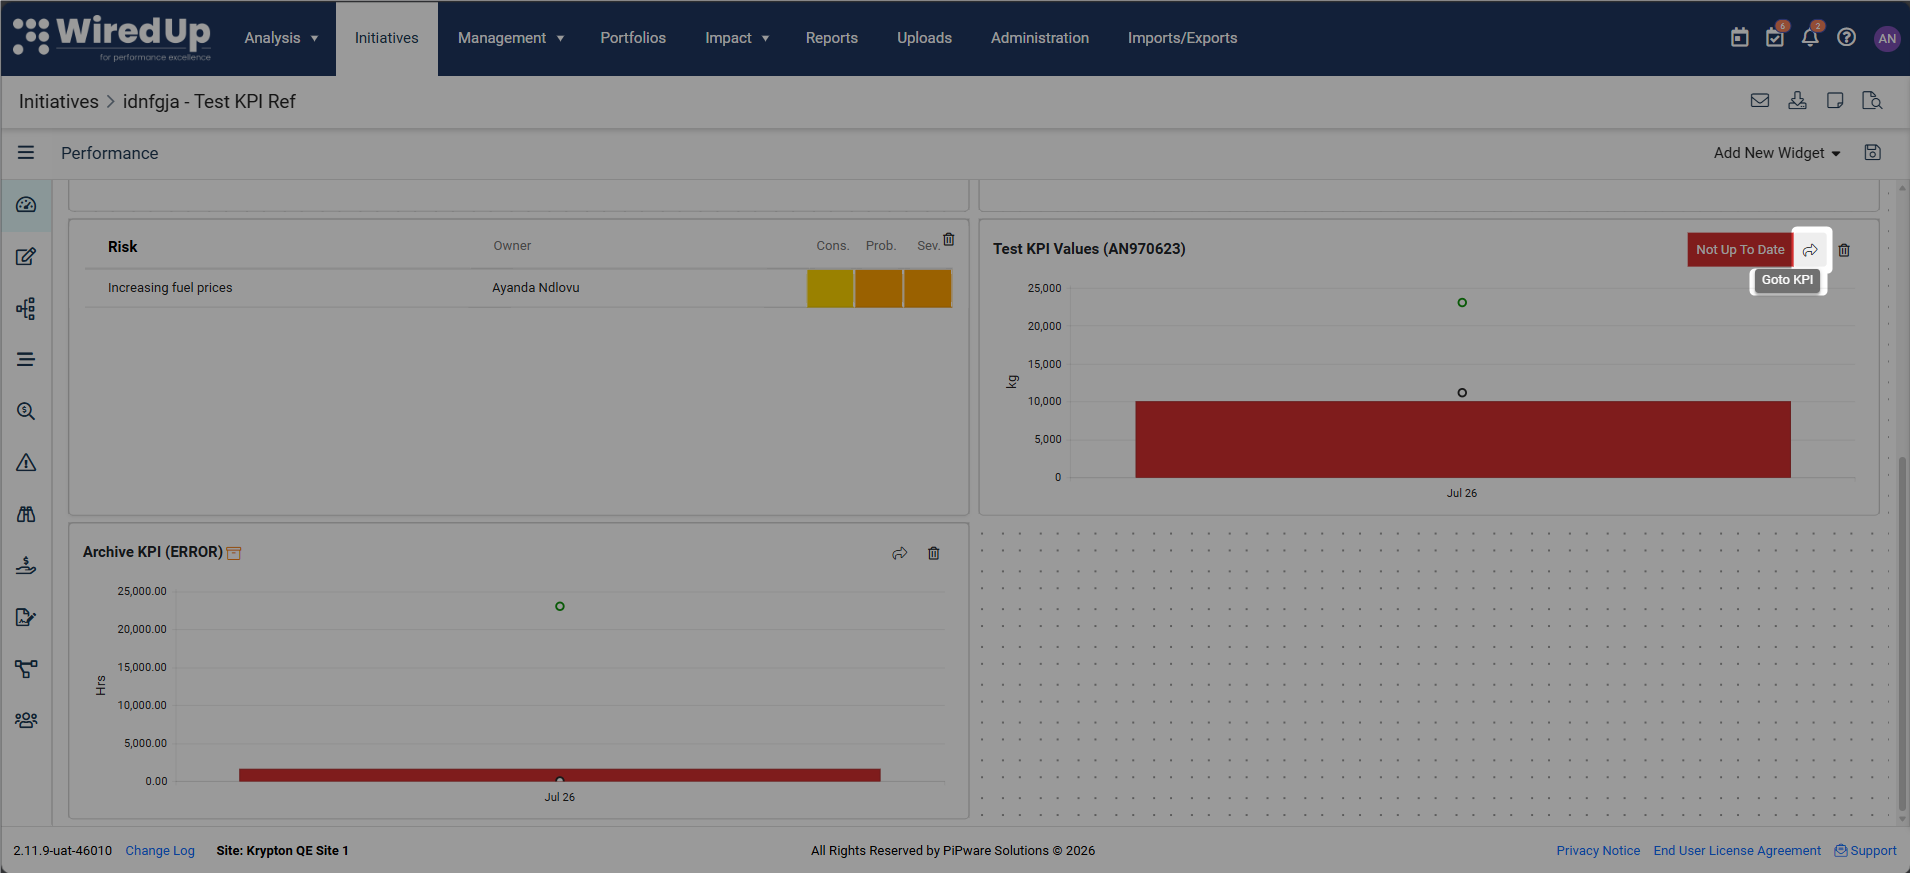
Clicking the curved arrow at the top right of the KPI widget will navigate to that KPI in the KPI module.
Widget Management Rules
When customizing your Performance page layout, the following rules apply:
Minimum Widget Requirement
The Initiative Performance page must contain at least one widget at all times
- If you attempt to remove the last remaining widget, the removal will be blocked
- You will see a message: "At Least One Widget Required" with the explanation: "The Initiative Performance page must contain at least one widget. Remove action is not available until another widget is added."
Non-Resizable Widgets
The following widgets have fixed sizes and cannot be resized within the dashboard-style layout:
- Timeline Status
- Benefit Delivery (all benefit types)
- Idea/Initiative Stage Indicator (Workflow Stage)
These widgets can still be moved and repositioned, but their dimensions are fixed.
Layout Persistence
- The configured widget layout is saved per Initiative
- The layout is not user-specific—all users with access to the Initiative see the same layout
- Any user with permission to edit the Initiative Performance page can modify the layout, and those changes will be visible to everyone
VDT Integration
- Widgets linked through the Value Driver Tree (VDT) are automatically added when relevant VDT changes occur
- Auto-added widgets are placed at the bottom of the existing layout
- Your existing custom layout is preserved when the VDT changes
- If a VDT element is removed, its corresponding widget is automatically removed from the Performance page
Next Steps
Now that you understand the Performance page and how to customize it, see the following articles:
Ideas/Initiatives Overview : WiredUp