In This Article
Viewing the Cumulative Benefits Report
Understanding the Chart Legend
- Monthly Gap to Pipeline Target for [Current Month] [ Current Year]
- Monthly Gap to Ideas Benefit Forecast for [Current Month] [Current Year] (top 12)
Overview
The Cumulative Benefit report shows the total benefits that have been delivered from ideas/initiatives over time vs. targets. The benefit (cash in the bank) is calculated based on the variance between the baseline and actual for any given month. The bars shown on the chart are the sum of idea/initiative benefits.
The report displays two charts—Actual Benefit Delivered and Cumulative Benefit Delivered—along with two monthly gap sections that help you understand how departments and ideas/initiatives contribute to benefit delivery.
Viewing the Cumulative Benefits Report
To access the report:

- Navigate to and click the Reports module
- Click on Cumulative Benefits to view the report
The report displays:
- Actual Benefit Delivered Chart — shows monthly benefit delivery
- Cumulative Benefit Delivered Chart — shows cumulative benefit over time
- Monthly Gap to pipeline target — left table showing department/site performance
- Monthly Gap to Ideas benefit forecast — right table showing idea/initiative performance
Understanding the Chart Legend
The chart legend displays the following metrics that you can toggle on or off:
- Idea Ongoing Benefit — the actual benefit delivered from ideas/initiatives (sourced from Idea/Initiative Benefits)
- Cash In — cash-in benefit component (sourced from Idea/Initiative Cashflows)
- Pipeline Target — the target benefit from your pipeline (sourced from Pipeline Targets)
- Idea Forecast — the forecasted benefit from ideas/initiatives (source from Idea/Initiative Forecast)
- Cash in Forecast — cash-in forecast component (sourced from Idea/Initiative Cashflows)
Toggling Chart Lines:
You can show or hide any of the benefit metrics by clicking on the items in the chart legend. When you click on a legend item:
- Disabled metrics appear in grey font
- Enabled metrics appear in their designated color
- The chart updates immediately to reflect your selection
Understanding the Terminology
- Idea Ongoing Benefit — The actual benefit delivered from ideas/initiatives. This represents the "cash in the bank" benefit that has been realized.
- Cash In — The cash-in component of the benefit, showing the actual cash impact.
- Pipeline Target — The target benefit set for your pipeline, typically configured at the department or program level. This is calculated based on your pipeline configuration.
- Idea Forecast — The forecasted benefit for individual ideas/initiatives based on their expected performance.
- Gap To Target — The difference between the Idea Ongoing Benefit and the Pipeline Target. A negative gap (shown in red) indicates underperformance against the target.
- Gap To Forecast — The difference between the Idea Ongoing Benefit and the Idea Forecast for each idea/initiative.
Report Filters
Applying Filters:
To apply filters to the report:
- Click the Filter icon (funnel icon) at the top right corner of the page. The Filter panel will open on the right side.

- Configure your desired filters:
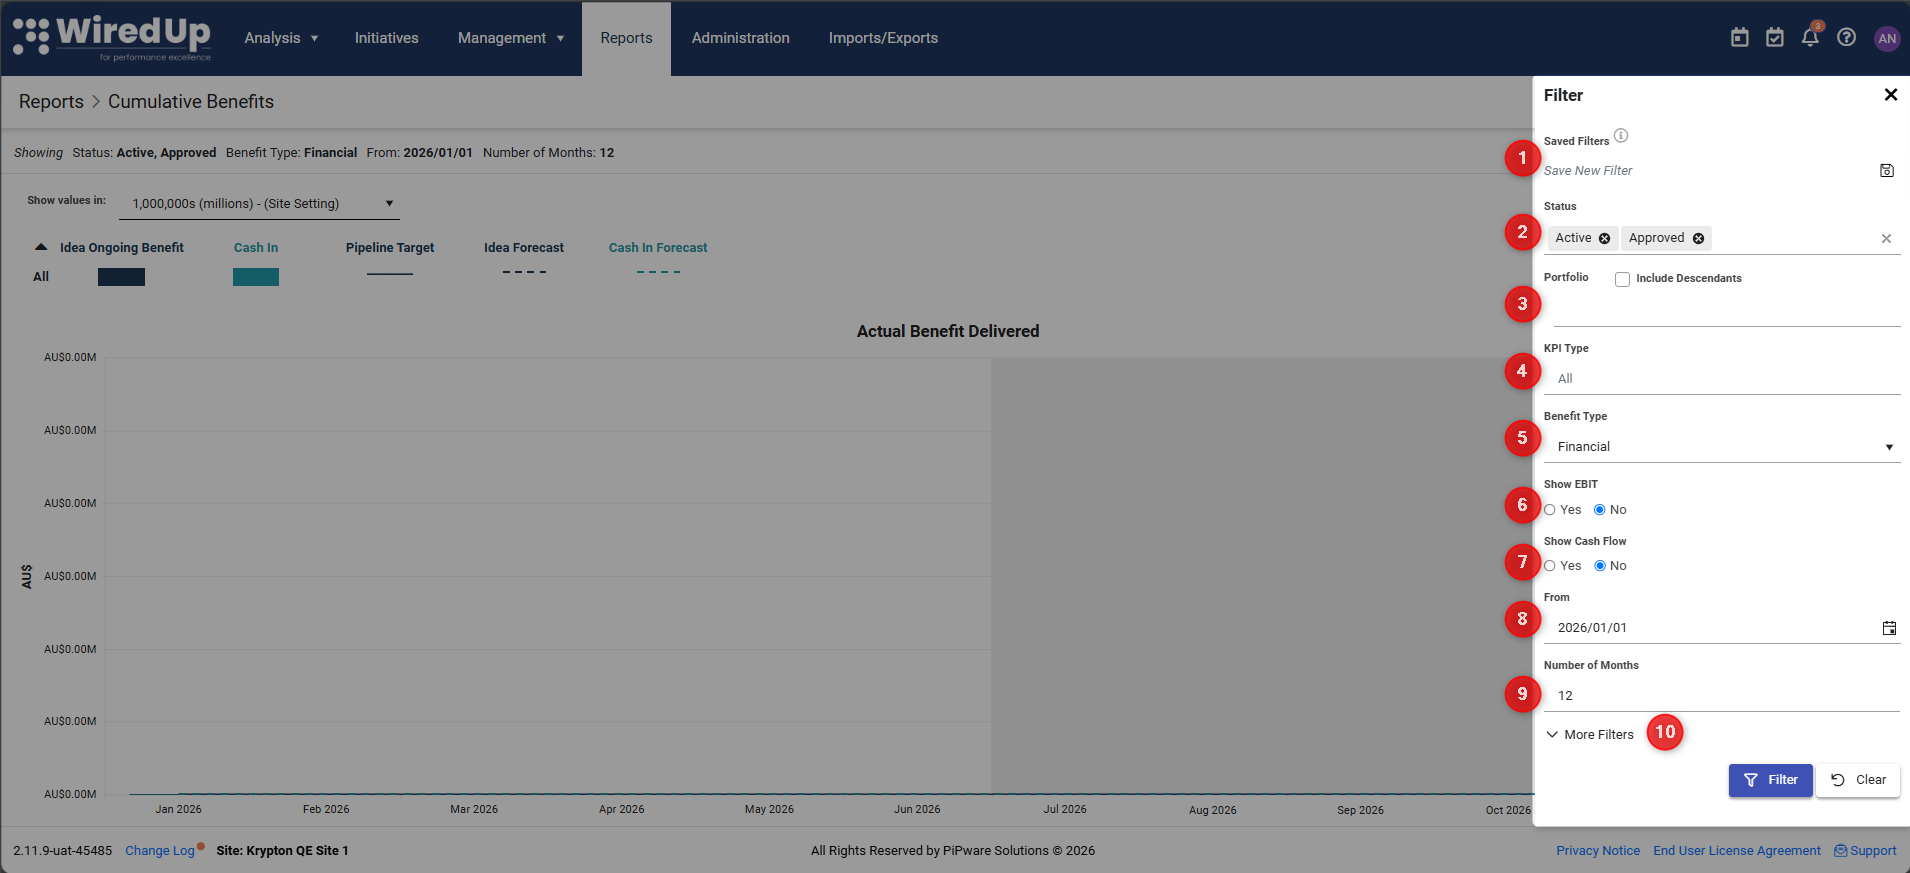
- Saved Filters — to save your filter configuration for future use, click the Save button on Save Filters
- Status — select which idea/initiative statuses to include in the report (multi-select). By default, Active and Approved are selected. You can also select On Hold, Cancelled, Completed, and Archived to include historical or non-active ideas/initiatives in your analysis. This allows you to review benefit delivery from ideas that are no longer active without having to change their status.
- Portfolio — select specific portfolios and optionally include descendants
- KPI Type — filter by KPI type
- Benefit Type — select Financial or other non-financial benefit types
- Show EBIT — toggle to show/hide EBIT values
- Show Cash Flow — toggle to show/hide cash flow values
- From — select the start date for the report period
- Number of Months — specify how many months to display
- Additional filters available under More Filters
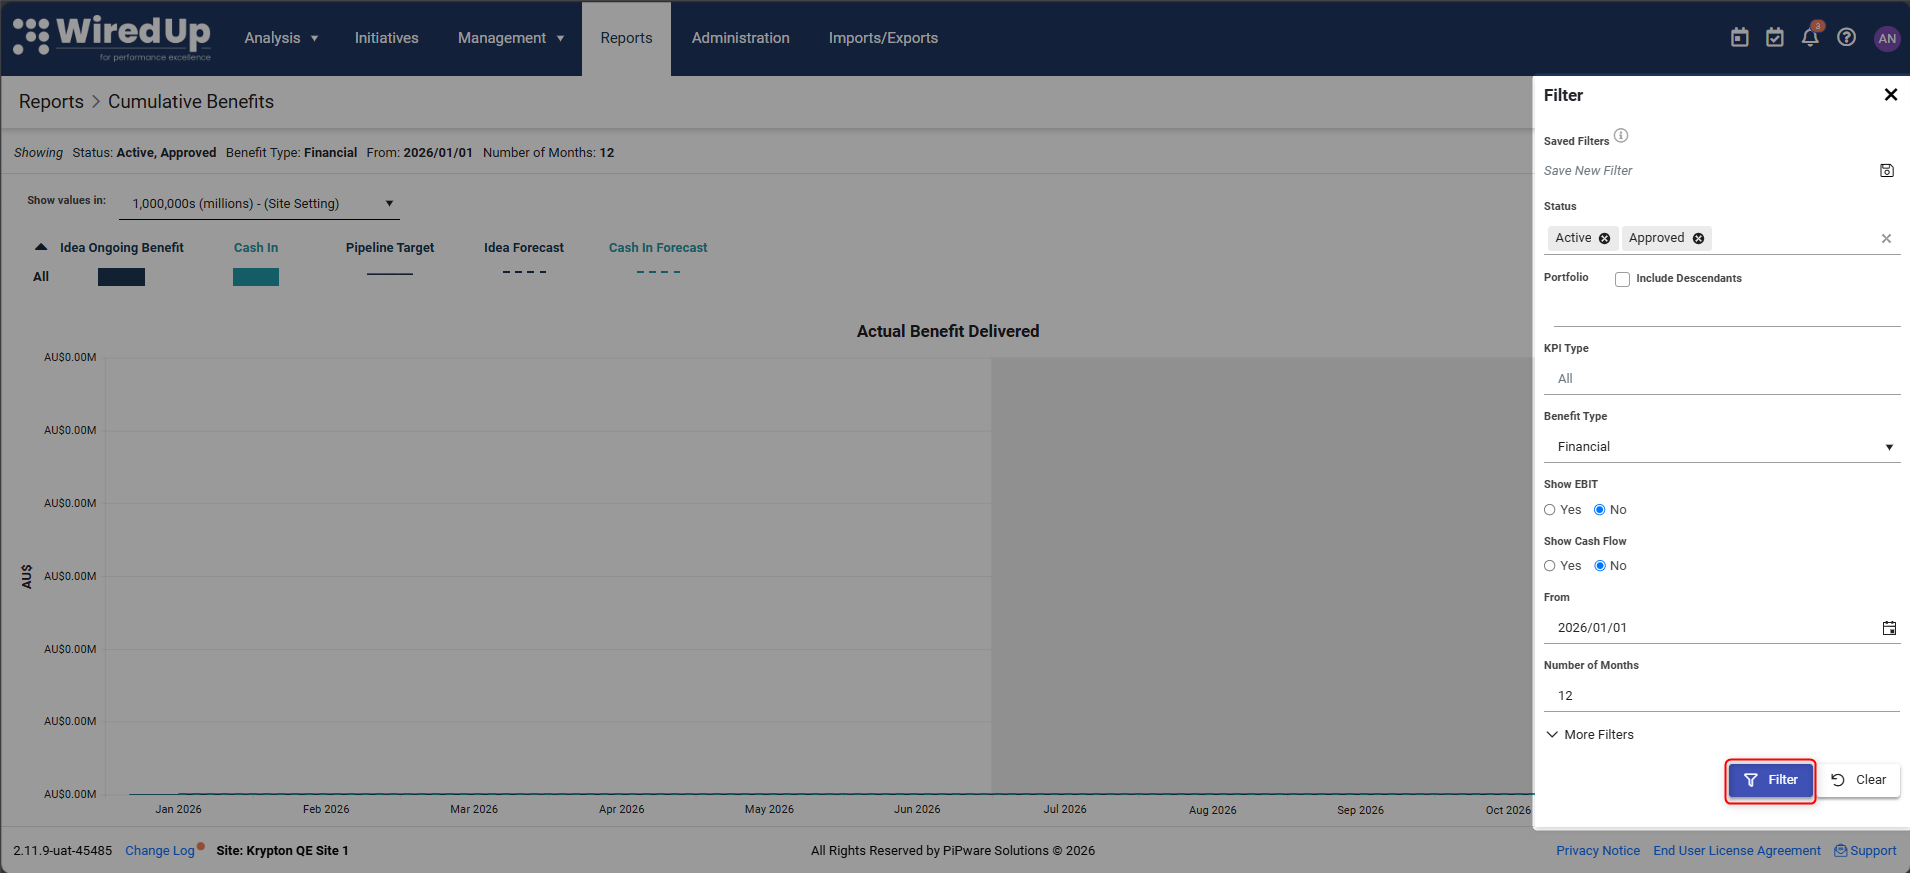
- Click the Filter button at the bottom of the panel to apply your selections
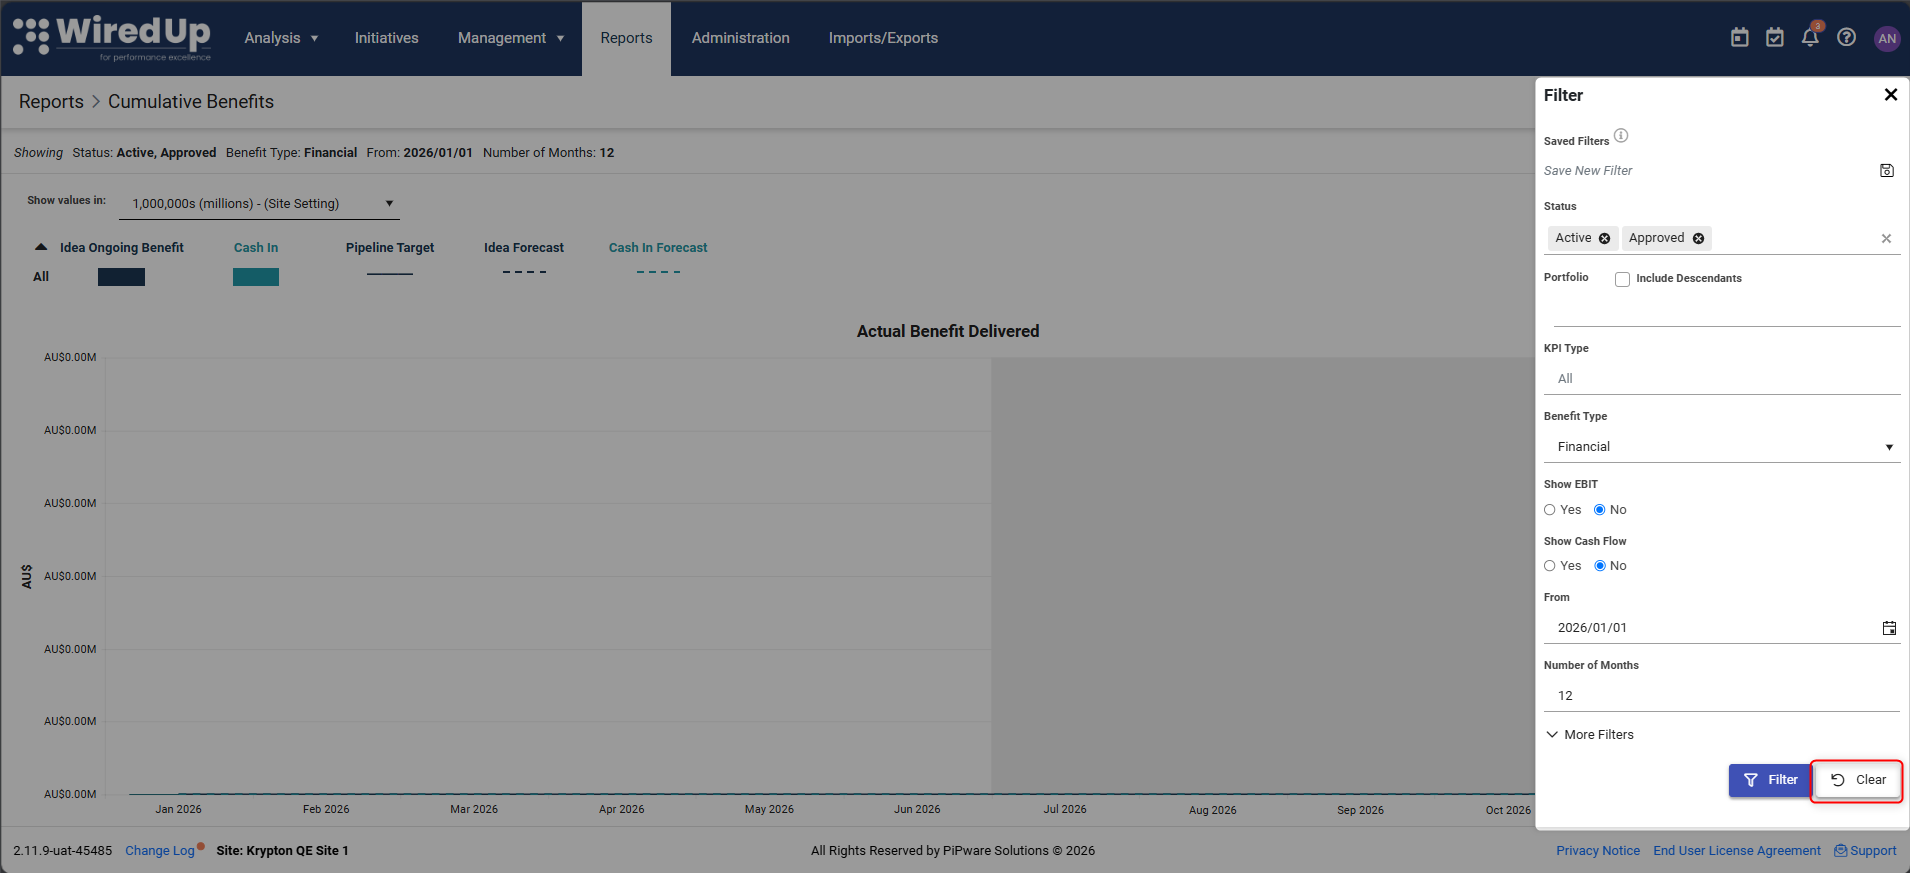
- To remove all filters, click the Clear button
Note: The filters applied will affect both charts and both monthly gap tables.
Value Formatting
You can select which type of formatting you want to view the values in on the charts using the Show values in dropdown at the top of the report.
The global value formatting setting can be configured in the following locations:
- On PMO: Portfolios > Configuration > Settings > under Initiatives > edit Display Factor for Initiative values in reports
- On CI: Administration > Organisational Structure > Configuration > Settings > under Ideas > edit Display Factor for Idea values in reports
Downloading the Report

The report can be downloaded in either PDF or Excel format by clicking the Download icon (download symbol) at the top right corner of the page and selecting your preferred format.
Monthly Gap Sections
Below each chart, two monthly gap tables appear side by side:
Monthly Gap to Pipeline Target for [Current Month] [ Current Year]
This table, displayed on the left side, shows how each department and sub-department contributes or performs against the pipeline target.
Columns:

- Benefit Type — the type of benefit being measured (e.g., Financial)
- Department/Site — organizational unit (expandable to show sub-departments)
- Idea Ongoing Benefit — actual benefit delivered
- Pipeline Target — target benefit from the pipeline
- Gap To Target — variance between actual and target (shown in red if negative)
- Pareto — visual bar showing relative contribution
Cumulative View: When viewing the Cumulative Benefit Delivered chart, this table shows Cumulative Gap to pipeline target as at [Month] [Year] with cumulative values.
Monthly Gap to Ideas Benefit Forecast for [Current Month] [Current Year] (top 12)
This table, displayed on the right side, shows the top 12 ideas/initiatives that contribute to the actual/cumulative benefit delivered.
Columns:

- Idea # — the idea/initiative code
- Site — the site where the idea/initiative is implemented
- Idea Name — the name of the idea/initiative
- Idea Ongoing Benefit — actual benefit delivered
- Idea Forecast — forecasted benefit for the idea/initiative
- Gap To Forecast — variance between actual and forecast
Cumulative View: When viewing the Cumulative Benefit Delivered chart, this table shows Cumulative Gap to Ideas benefit forecast as at [Month] [Year] (top 12) with cumulative values.
Drilling Down: You can click on any idea/initiative name in the right table to navigate directly to the full details in the Initiatives/Ideas module.