In This Article
Accessing the KPI Values Screen
Understanding the KPI Values Grid
Adding Comments and File Attachments
Selecting and Deleting Multiple KPI Values
Tips for Managing KPI Values Effectively
Overview
The KPI Values screen allows you to manually enter, edit, and manage actual performance data, targets, baselines, and forecasts for your KPIs. This data is used throughout WiredUp in charts, dashboards, reports, and Value Driver Trees. This article explains how to access the KPI Values screen, add and edit values, add comments and attachments, use filters, and save your entries.
Accessing the KPI Values Screen
To access the KPI Values screen:
- Navigate to Analysis in the main menu
- Select KPIs from the dropdown options
- Click on the Name of the KPI you want to update
- Click the three-bar menu (hamburger icon) on the left side of the title
- Select Values from the menu
- The KPI Values grid will display
Understanding the KPI Values Grid
The KPI Values grid displays all entered values for your KPI in a table format. The grid typically shows:
- Unit of Measure: The unit displayed for the KPI at the top of the grid
- Select/Deselect checkbox: click the checkboxes to select/deselect multiple KPI values for bulk delete
- Date: The date for which the value is captured
- Actual: The actual performance value achieved
- Baseline: The baseline value for comparison
- Target: The target value for that period
- Actual Forecast: The Actual Forecast value of the KPI. This value can also be used as a forecast value for an initiative by selecting Actual Forecast as a forecast type on Initiative Forecast
- Custom Targets: Alternative target values (configured in Site Configuration)
- Add Comment: add or view a comment or attachment associated with a KPI value
- Delete: click this icon to delete a KPI value from the list
Note: All value columns are displayed by default except for Custom Targets, which are configured in Site Configuration.Adding KPI Values
To add a new value to your KPI:
- Open the KPI Values screen
- Scroll to the bottom of the values grid
- Enter the required information:

- Date: Select the date for this value
- Actual: Enter the actual performance value (if applicable)
- Baseline: Enter the baseline value (if applicable)
- Target: Enter the target value (if applicable)
- Actual Forecast: Enter the actual forecast value (if applicable)
- Custom Targets: Enter custom target values (if configured in Site Configuration)
- Click the +Add button to add the value to the KPI values
- Click Save in the top-right corner to preserve your entry
Important: Always click Save after adding values. If you navigate away without saving, your entries will be lost.Adding Multiple Date Rows at Once
You can now generate multiple empty date rows at once using the Add Date Rows feature, which is particularly useful when setting up a new KPI or backfilling historical periods.
To add multiple date rows:

- Open the KPI Values page for the KPI you want to manage
- Click the Add Date Rows button in the app bar
- The Add Date Rows modal will open with three sections: Period, Cadence, and Preview
Defining the Period:
The Period section defines the date range for which rows will be generated.
- Predefined Period — choose from common date ranges (This Week, This Month, This Quarter, This Year, This FY [as defined on Site Settings])

The default predefined period selected is This Month- Custom Period — manually define a start and end date using the From Period and To Period date pickers

The default custom period is the first day and last day of the current monthDefining the Cadence:
The Cadence section defines how often date rows are generated within the selected period. The available cadence options are:
- Daily — generates rows for every day or every weekday

- Weekly — generates rows for selected days of the week (you can select multiple days)
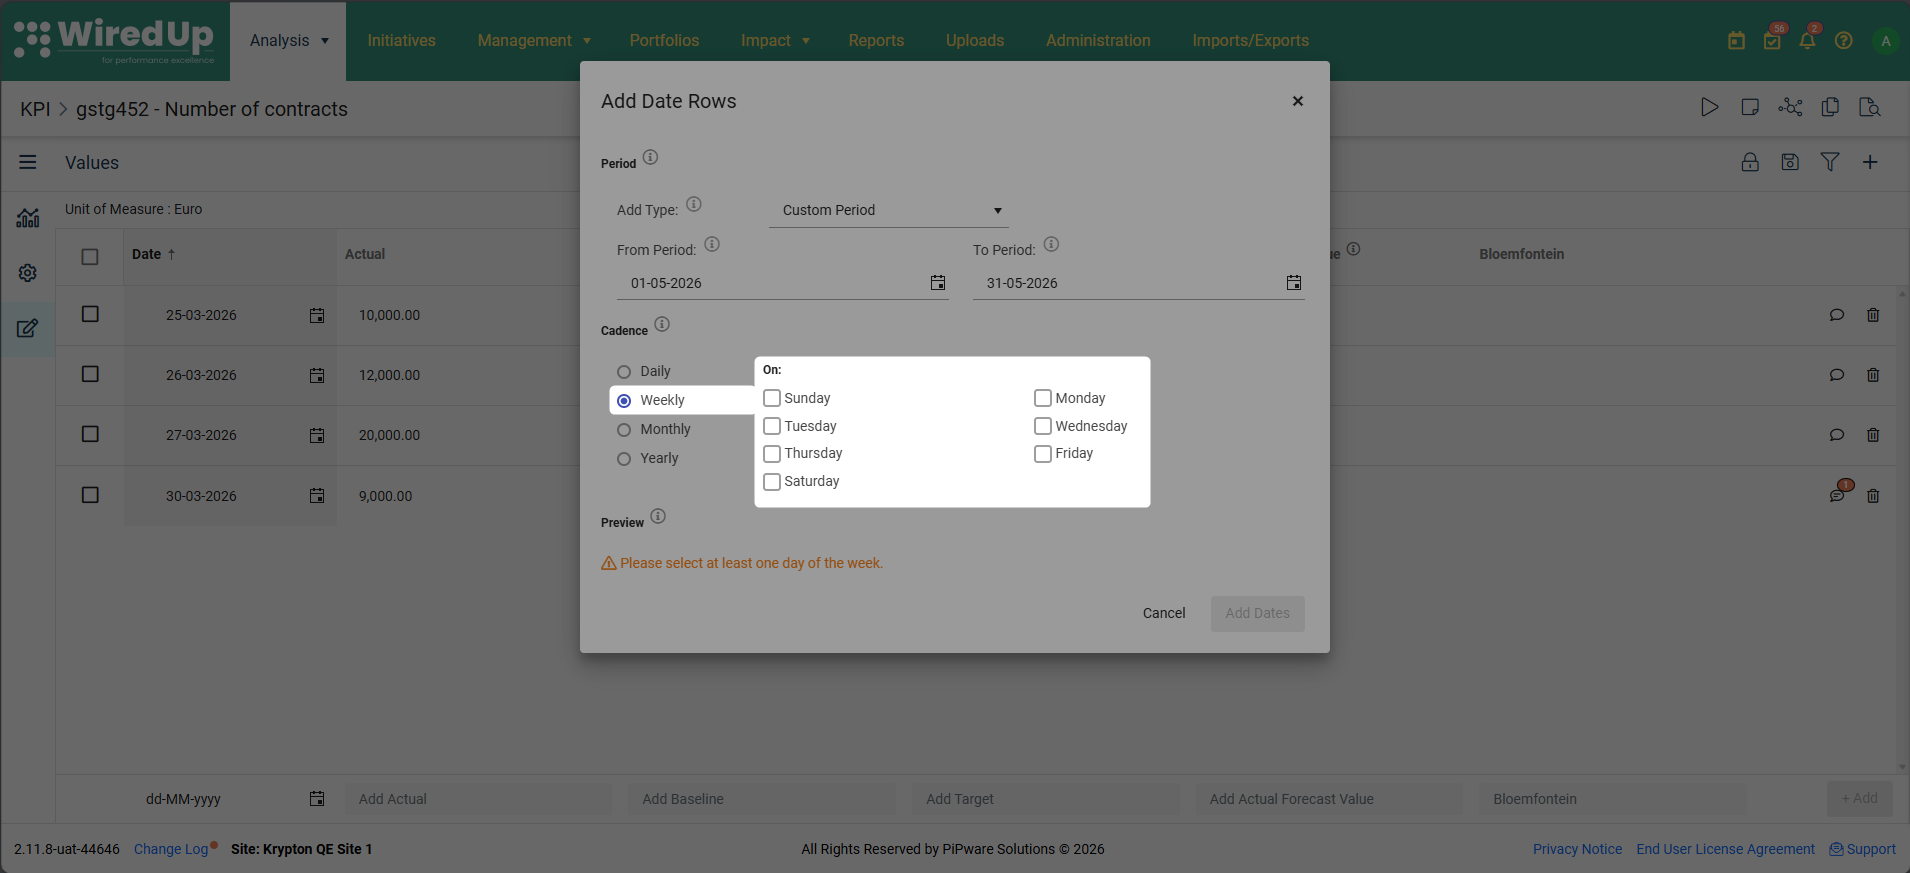
- Monthly — generates rows on a specific day of each month (e.g., Day 26) or on a specific weekday (e.g., the fourth Thursday)

- Yearly — generates rows on a specific date each year (e.g., March 26) or on a specific weekday (e.g., the fourth Thursday of March)

A Yearly cadence requires This Year or This FY as the Predefined Period. Other predefined periods will display a warning prompting you to select a longer range or different cadence

Previewing and Adding:
The Preview section shows all dates that will be generated before you confirm.
- Dates that will be added appear in normal black text
- Dates that already exist appear with strikethrough and an "Already exists" label
- A summary line shows how many rows will be added and how many dates will be skipped
- If you selected Day 31 for a monthly cadence, a warning will appear explaining that the last day of the month will be used for months with fewer than 31 days
To complete the process:
- Review the preview list
- Click Add Dates to generate the rows, or Cancel to close without adding

- All generated rows are added as empty rows to the KPI Values table
- The table automatically scrolls to the first newly added row
- Each added row generates its own "KPI Value Added" entry in the Change Log

Note: If a period is locked and you are not the KPI Owner, you cannot add rows to that period. The Add Date Rows button is hidden for archived KPIs.
Adding Comments and File Attachments
You can add comments and file attachments to individual KPI value entries to provide additional context, documentation, or explanations.
Adding or Viewing Comments
To add or view a comment for a KPI value entry:
- Locate the value entry in the KPI Values grid
- Click on the Add Comment icon located on the row of the value

- The Notes and Attachments panel will open

- Enter your comment text in the comment field

- Click Post Comment to add the comment

When to use comments:
- Explain unusual or unexpected values
- Document data sources or calculation methods
- Provide context for significant changes in performance
- Note any data quality issues or corrections
- Record assumptions or adjustments made to the data
Adding File Attachments
To add a file attachment to a KPI value entry:
- Locate the value entry in the KPI Values grid
- Click on the Add Comment icon located on the row of the value

- The Notes and Attachments panel will open

- Click the + icon and select Attachment

- Select the file you want to attach from your computer

- Click Add to preserve the attachment

When to use attachments:
- Attach source documents or reports that support the entered value
- Include screenshots or images that provide visual evidence
- Upload calculation spreadsheets showing how values were derived
- Attach approval documents or sign-offs
- Include relevant correspondence or meeting notes
Tip: Use comments and attachments to create an audit trail and provide transparency for your KPI data. This is especially important for KPIs used in compliance reporting or executive decision-making.Note: For more information about adding comments and attachments, refer to the KPI Commentary Feature article.Editing KPI Values
To edit an existing value:
- Open the KPI Values screen
- Locate the value you want to edit in the grid
- Click directly into the cell you want to modify
- Enter the new value
- Click Save in the top-right corner to preserve your changes
Tip: You can edit multiple values before saving. Make all your changes, then click Save once to save all edits.Selecting and Deleting Multiple KPI Values
You can now select and delete multiple KPI value rows at once using checkboxes, which is particularly useful when managing KPIs with large volumes of data.
To delete multiple KPI values:
- Open the KPI Values screen for the KPI you want to manage
- Click the checkbox next to each value row you want to delete
 Tip: Click the Select All checkbox in the column header to select all rows at once
 - Once you have selected one or more rows, a delete icon will appear in the app bar located at the top-right of the page

- Click the delete icon

- A confirmation modal will appear showing the number of rows you are about to delete

- Click Delete to confirm, or Cancel to close the modal without deleting
After deletion:
- All selected rows are removed from the KPI Values table
- The checkboxes are automatically cleared
- Each deleted row generates its own KPI Value Deleted entry in the Change Log
Note: If a period is locked and you are not the KPI Owner, the checkbox for that row will be disabled. Locked period rows cannot be selected for deletion by non-owners. Hover over a disabled checkbox to see the message: "This period is locked. Please contact the KPI Owner to request changes."Important: Remember to click Save after making any changes to ensure your updates are recorded.Filtering KPI Values
The Filter icon in the top-right corner of the values grid allows you to narrow down the displayed values by date range.
Using the Filter

- Click the Filter icon in the top-right corner
- Select a From Date (start date)
- Select a To Date (end date)
- Click Filter to filter the KPI Value list. The grid will display only values within the selected date range
- Click Clear to remove the filter and view all values again
When to use filters:
- When working with KPIs that have extensive historical data
- When you need to focus on a specific time period for data entry or review
- When verifying values for a particular reporting period
Saving Your Changes
After adding or editing KPI values:
- Review all your entries to ensure accuracy
- Click the Save button in the top-right corner of the screen
- Your changes will be saved to the system
- The values will immediately be available in charts, dashboards, and reports
Warning: If you navigate away from the Values screen without saving, all your changes will be lost. Always click Save before leaving the screen.Viewing KPI Value Change History
All changes made to KPI values are now automatically tracked in the KPI Change Log, providing a complete audit trail of who changed what values, when they were changed, and what the previous values were.
What is tracked:
The Change Log captures all value changes made on the KPI Values page, including:
- Adding new value rows
- Editing existing values (showing old value → new value)
- Deleting value rows
- Changes made via bulk import
- Changes made via API uploads
Tracked columns:
All value columns are tracked:
- Actual
- Baseline
- Target
- Actuals Forecast Value
- All custom target columns configured for the KPI
To view value change history:
- Open the KPI you want to review and navigate to the Values menu

- Click the Audit icon located at the top right to open the change log

- Value change entries appear alongside other KPI changes, ordered by timestamp (most recent first)

Understanding Change Log entries:
Each value change is recorded as a separate card in the Change Log. Multiple column changes on the same row within a single save action are grouped into one card.
- KPI Value Added:

- Shows the date of the new value row
- Lists each column that has a value (empty columns are not shown)
- Displays who added the value and when
- KPI Value Updated:

- Shows the date of the value row that was changed
- Lists each column that was changed in the format: [old value] to [new value]
- Only changed columns are shown (unchanged columns are not listed)
- Displays who updated the value and when
- KPI Value Deleted:

- Shows the date of the deleted value row
- Lists each column that had a value before deletion
- Displays who deleted the value and when
Note: For bulk imports and API uploads, each value row generates its own Change Log entry. API changes are attributed to "System" or the API user identifier.
Understanding Value Types
Actual Values
Actual values represent the real performance data achieved for each time period. These are the primary values used to assess KPI performance.
Best practices:
- Enter actual values as soon as data becomes available
- Ensure accuracy before saving
- Use consistent date formats aligned with your KPI's target frequency
Target Values
Target values represent the desired performance level for each period. Targets can be constant or vary by time period.
Note: If you set a Default Target in the KPI configuration, you may not need to enter individual target values unless they vary by period.
Baseline Values
Baseline values represent the starting point or reference level before improvement efforts begin.
Note: If you set a Default Baseline in the KPI configuration, you may not need to enter individual baseline values unless they vary by period.
Actual Forecast Values
Actual Forecast values represent the forecasted actual performance for future periods.
Use cases:
- Planning and budgeting scenarios
- Anticipating whether targets will be met
- Identifying when intervention may be needed
- Using as a forecast value for an initiative by selecting Actual Forecast as a forecast type on Initiative Forecast
Custom Targets
Custom targets are alternative or adjusted targets that differ from the default target.
Use cases:
- Stretch goals in addition to standard targets
- Variable targets that change by time period
- Multiple target scenarios
Note: Custom Targets must be configured in Site Configuration before they can be entered.
How KPI Values Are Used
The values you enter in the KPI Values screen are used throughout WiredUp:
KPI Charts
- Actual values are plotted as bars or data points
- Target and baseline values appear as lines
- Actual Forecast values show projected future performance
KPI Cards
- Display summary metrics (Actual, Target, Variance) for the configured Performance Period
- Show performance status (On Track, Off Track, At Risk)
- The "Updated" indicator is based on the latest Actual value date
Dashboards
- KPI widgets display current performance based on entered values
- Charts and cards update automatically when new values are saved
Value Driver Trees (VDTs)
- VDT variable nodes source Baseline, Target, and Actual values from the KPI Values page
- Monthly calculated method KPI values are used for VDT calculations
- If values don't exist for a period, VDTs may show blanks or nulls
Initiative Forecasts
- Actual Forecast values can be used as forecast values for initiatives
- Select Actual Forecast as the forecast type on Initiative Forecast to use these values
Reports
- Performance reports pull actual and target data from the Values screen
- Variance calculations are based on the entered values
Tips for Managing KPI Values Effectively
- Enter values regularly: Keep your KPI data current by entering values as soon as they become available
- Verify before saving: Double-check values for accuracy before clicking Save
- Use filters for large datasets: When working with years of data, filter by date range to focus on specific periods
- Document unusual values: Use the Notes and Attachments icon to explain anomalies or significant changes
- Attach supporting documentation: Upload source documents to create an audit trail
- Check the "Up to Date" status: Regularly review the KPI List to identify KPIs that need updating
- Consider bulk import: For large volumes of data, use the KPI import template instead of manual entry
Troubleshooting
If you've entered values but they don't appear on the KPI Chart:
- Check the Unit of Measure display factor: If set to 0, values will display as 0 (value × 0 = 0). Update in Administration → Units of Measure
- Check chart Min/Max settings: Values outside the chart's Min/Max range won't be visible. Adjust in Chart Options
- Verify you saved: Ensure you clicked Save after entering values
- Check the date range: Ensure the chart's time period settings include the dates for your entered values
If values don't appear in Value Driver Trees:
- Check calculation method: VDTs typically require monthly calculated method KPI values
- Verify value types: Ensure you've entered the correct value types (Actual, Baseline, Target) that the VDT expects
- Check date alignment: Ensure values exist for the periods the VDT is analyzing
Next Steps
Now that you understand how to manage KPI Values, you may want to explore:
- KPI Commentary: Explore how comments and attachments are captured for KPIs
- KPIs Import Template: Learn how to bulk import KPI values using Excel