
In This Article
Pending & Outstanding Approvals
Overview
To customize your dashboard, simply add the widgets that suit your needs. To do so, navigate to the Edit mode of your dashboard and select Add New Widget. You'll find a variety of widgets to choose from that can enhance your dashboard experience. These are currently the available widgets available:
- Other Activities
- Portfolio Activities
- Activity Completion
- Pending & Outstanding Approvals
- Cumulative Benefits
- Cumulative Pipeline
- Escalated Activities
- Escalated Risks
- External Link
- Initiatives
- Key Performance Indicator
- KPI Chart
- Meetings
- Portfolio Value
- RARs
- Risks
- Summary Completion
- Top 25 Initiatives
- Total Benefits to Date
Activities Widgets
The Other Activities, Portfolio Activities, Activity Completion and Escalated Activities displays a list of actions based on the selected configuration, e.g:
- How far ahead in the future displayed actions should be shown.
- How far back historical actions be displayed.
- Filter actions created by the user, owned by the user or both.
- Show only actions that are completed, outstanding or both.
Click the action name to edit the action or mark the action as complete by ticking the box.
To see the source of the action, you will need to hover over the displayed icon (bulb-icon for ideas, calendar-icon for meetings and users-icon for Rs), as per the image below.
Background colours in the date field make it easier to identify actions.
Blue - not yet due
Green - complete
Red - overdue

 | Overdue actions / action category - this will show any outstanding and late actions |
 | Later actions / action category - this shows upcoming, but not overdue actions |
 | Settings - allows customisation of the widget (changing dates etc) |
 | Action date - the planned completion date |
 | Complete tick box - select this if the action is complete |
 | Delete widget |
For more information on the Actions Dialogue box, please see the following article: Actions Dialogue Box
Pending & Outstanding Approvals
The widget labeled "Pending & Outstanding Approvals" showcases a list of both pending and outstanding approvals. The only customizable aspect of this widget is its title.

Clicking on the "i" symbol displays the Workflow approval summary. This provides a breakdown of the approval process to date, as per image below:

Cumulative Benefit Report
The Cumulative Benefit Report widget showcases the Cumulative Benefit Report, with the complete configuration of the report readily accessible by clicking on the config icon at the top right of the screen.


Cumulative Pipeline Report
The Cumulative Pipeline Report widget showcases the Cumulative Pipeline Report, and the complete configuration of the report is readily accessible by clicking on the config icon at the top right of the screen.


Escalated Risk
The Escalated Risk widget enables the users to add escalated risk related initiatives to the dashboard. Clicking on the source name of the risk navigates to the Idea/Initiative module.

External Links
Display the content of an external web URL.

Ideas
Display a List of Ideas the user has access to, the following configuration is available:
- Title of the widget
- Show your own ideas, ideas you facilitate, or ideas you are the primary KPI owner off.
- Only show ideas in a specific stage, or all stages.
- Only show ideas in a specific status, or all statuses.


Key Performance Indicator
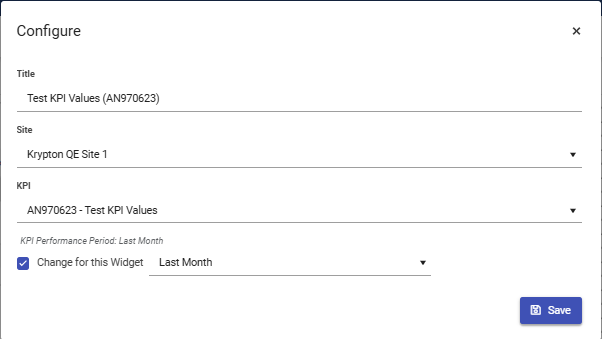
Display a KPI status indicator, the following configuration is available:
- Title: Name of the widget.
- Site: Select the site to filter for the KPIs for that site
- KPI: Select the KPI to be shown in the widget.
- KPI Performance Period: Below the KPI dropdown, the widget configuration displays the KPI's currently configured performance period as a read-only label (e.g., "KPI Performance Period: Last Month"). This shows you which performance period the KPI is using by default.
- Change for this Widget: Check this checkbox to override the KPI's default performance period for this specific widget only. When checked, a performance period dropdown appears with the following options:
- Current Month
- Current Week
- Day
- Last Month
- Last Week
- YTD
- When "Change for this Widget" is unchecked (default), the widget uses the KPI's own configured performance period. When checked and a performance period is selected, the widget displays data for the selected period, overriding the KPI's default setting for this widget only.

Note: Each KPI widget on your dashboard can have its own independent performance period override. The selected override persists across sessions and will be remembered when you return to the dashboard.
Note: if the Site drop-down menu does not appear, consider whether the country and region have been selected for that specific site. This can be done on the configuration settings of the site on the Portfolio module (for CI clients, this is done on the Organisation Structure settings on Administration module)
KPI Chart
Displays a KPI chart; the following configuration is available:
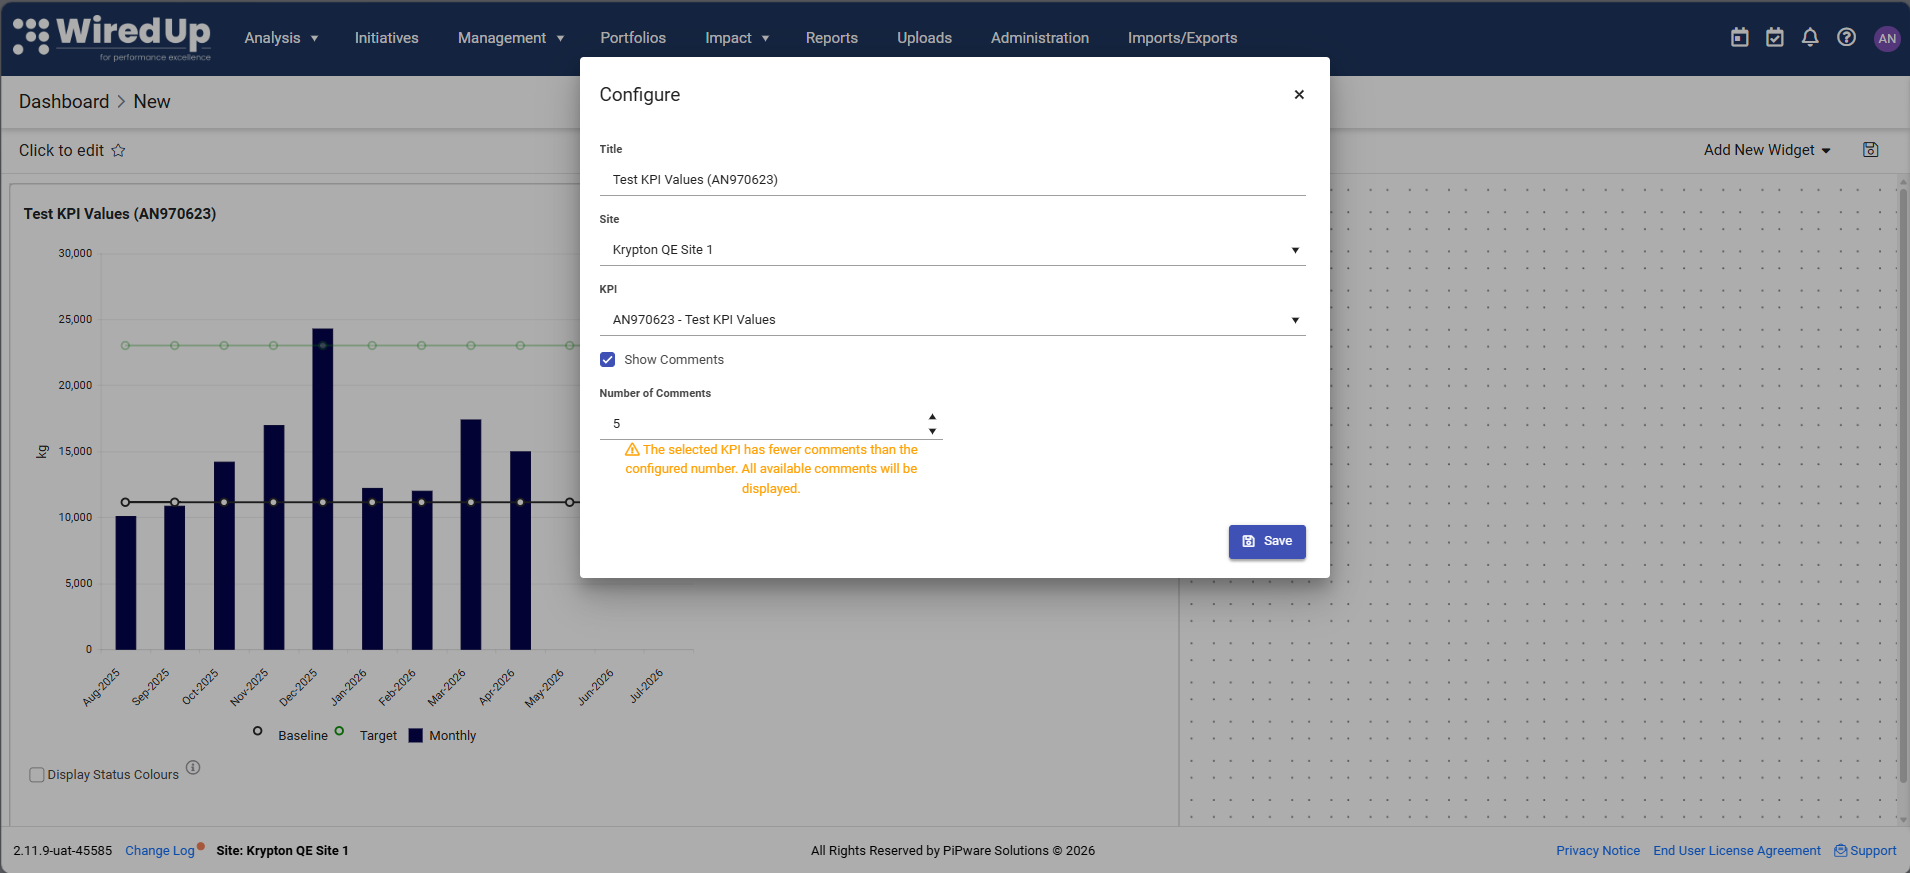
- Title: Name of the widget
- Site: Select the Site that is applicable to the KPI chart (this setting is only available for multi-site users)
- KPI: Select the KPI to be shown in the widget
- Show Comments: Check this checkbox to display KPI comments alongside the chart. When enabled, the widget displays the KPI chart on the left (approximately 70% width) and a comments table on the right (approximately 30% width). Comments are sourced from the KPI's Notes & Attachments and provide context for performance trends without leaving the dashboard.
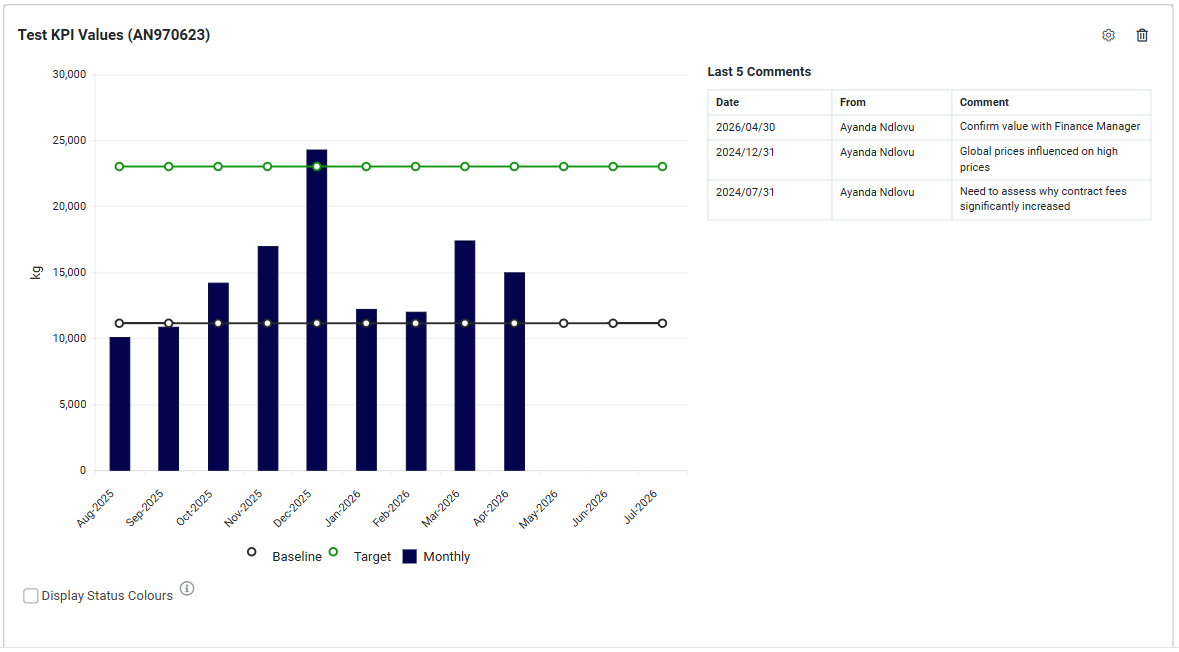
- Number of Comments: This field appears when "Show Comments" is checked. Specify how many recent comments to display (default: 5, maximum: 10). The comments table shows:
- Date — Effective date of the comment (or created date if no effective date)
- From — User who created the comment
- Comment — Comment text (truncated with ellipsis if too long; hover to see full text)
Comments are sorted by most recent first and only parent comments are displayed (replies are not shown). If the KPI has fewer comments than configured, all available comments are displayed. If no comments exist, an empty state message "No comments available" is shown.
Note: When "Show Comments" is unchecked (default), the widget displays only the KPI chart as before.

- By clicking on the backward arrow icon, you can open the KPI in a new window which will navigate you to the KPI window.
- By clicking on the Download icon, you can download the KPI chart
Meetings
Display a list of meetings; the following configuration is available:
- Title: Name of the widget.
- Show meetings for: Display list of meetings for today, next 7 days, next 14 days, or the next month.
- What meetings to show: Show all meetings, meetings you are the originator or meetings you are a participant off
- Portfolio: Select which departments meetings to show


Portfolio Value
The Portfolio Value widget shows the total value of the selected portfolio. The following configurations exist for portfolio values:
- Title: name of the widget
- Value: show portfolio value of Initiative Total or Cumulative Benefit Total
- Benefit Type: select to display benefit type from drop-down menu
- Portfolio: select the portfolio to view the portfolio value for
- Color: choose the color of the display font

RARs
Display a list of current RARs; the only configuration on this widget is the Title.

Risks
Displays all risks (not just escalated risks) related initiatives to the dashboard. Clicking on the source name of the risk navigates to the Idea/Initiative module. 
Summary Completion
The Summary Completion widget displays the activity completion status for the Portfolio.
Top 25 Initiatives
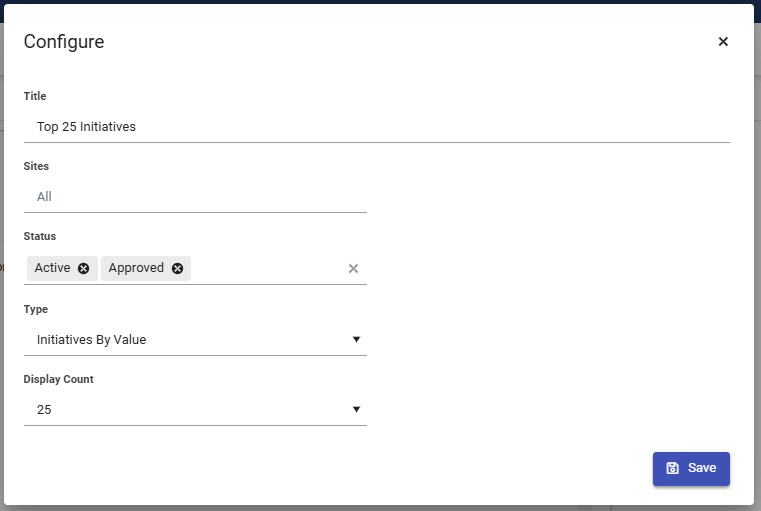
Displays the Top 25 Initiatives for a portfolio. The configuration includes changing the widget title, filter by site, initiative status, initiative type as well as the display value.
Status Filter Default: When you add this widget to your dashboard, the Status field is now included and automatically set to Active and Approved by default. This ensures the widget displays the most relevant and current initiatives without requiring manual configuration. You can change the selected statuses at any time by editing the widget configuration to include other statuses such as On Hold, Cancelled, Completed, or Archived if you need to monitor historical or non-active initiatives
Display Count: You can now customize how many initiatives are displayed on the widget by selecting a Display Count in the widget configuration. Choose from 5, 10, 15, or 25 initiatives (default is 25). The widget title updates dynamically to reflect your selection (e.g., "Top 5 Initiatives", "Top 10 Initiatives"). This feature works across all Top Initiatives widget types, including Initiatives By Value, Initiatives by Actual Benefit for current month, and Initiatives by Actual Benefit for last month, allowing you to optimize dashboard space and focus on the highest-ranking initiatives
Total Benefits to Date
Displays the total Benefits to date of a portflio. You can edit the title of the widget or include portfolio descendants in the config icon displayed on the top right side of the dashboard.