
In This Article
Exporting the RAR Compliance Report
Overview
The RAR Compliance Report provides a comprehensive view of reviewer compliance and quality metrics across your organization. This report helps you monitor how consistently reviewers are conducting their reviews and the quality of those reviews against established targets.
The onus is on the Reviewee to ensure that the RAR is completed. This report tracks compliance and quality to help identify where reviewees may need support or intervention.
The report displays both visual charts and detailed tables showing:
- Compliance: The percentage of reviews completed on time
- Quality: Quality scores based on review questions answered during RAR sessions
- Number of RARs: The total count of RARs conducted
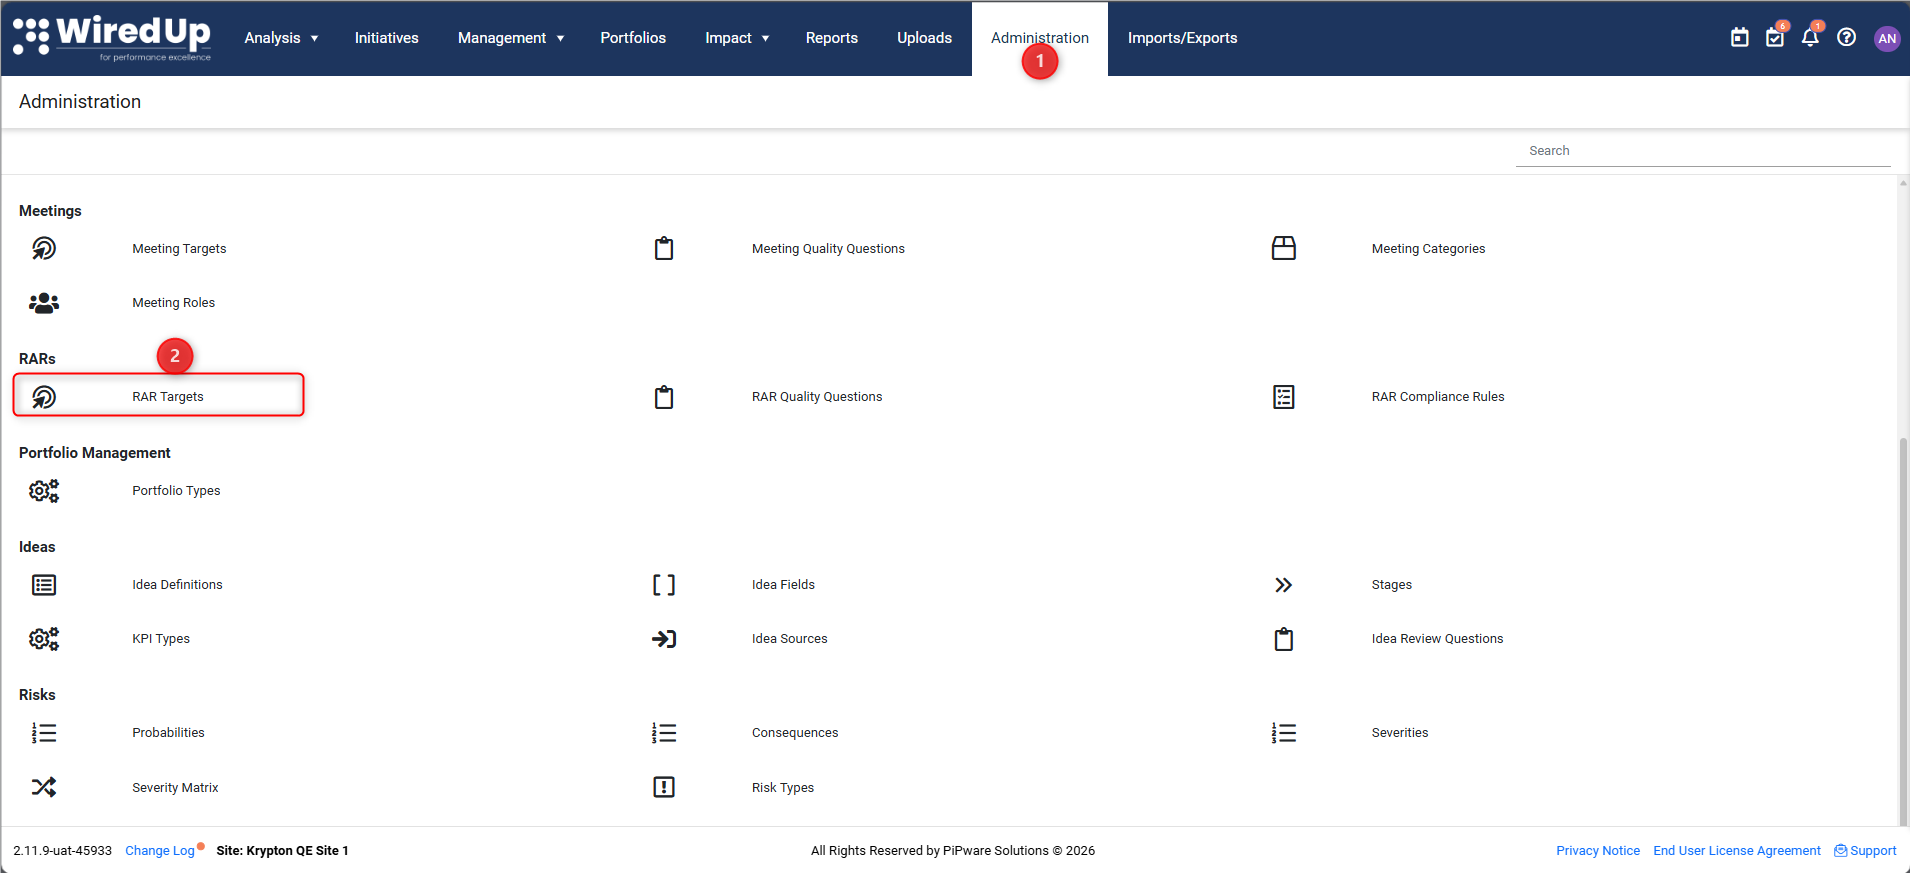
Quality and RAR targets are configured in Admin > RAR Targets, which define the benchmarks used throughout this report.
Prerequisites
Before you can access and use the RAR Compliance Report, ensure the following:
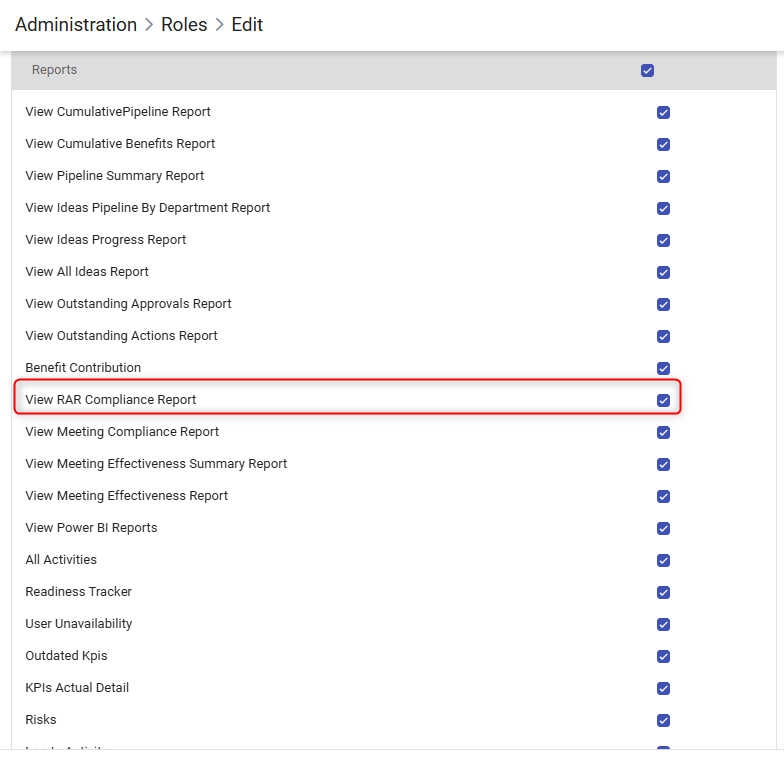
- You must have the View RAR Compliance Report role permission, located under Reports section, assigned to your role
- Quality and RAR targets must be configured in Admin > RAR Targets for the report to display meaningful compliance and quality metrics
Accessing the Report
To access the RAR Compliance Report:
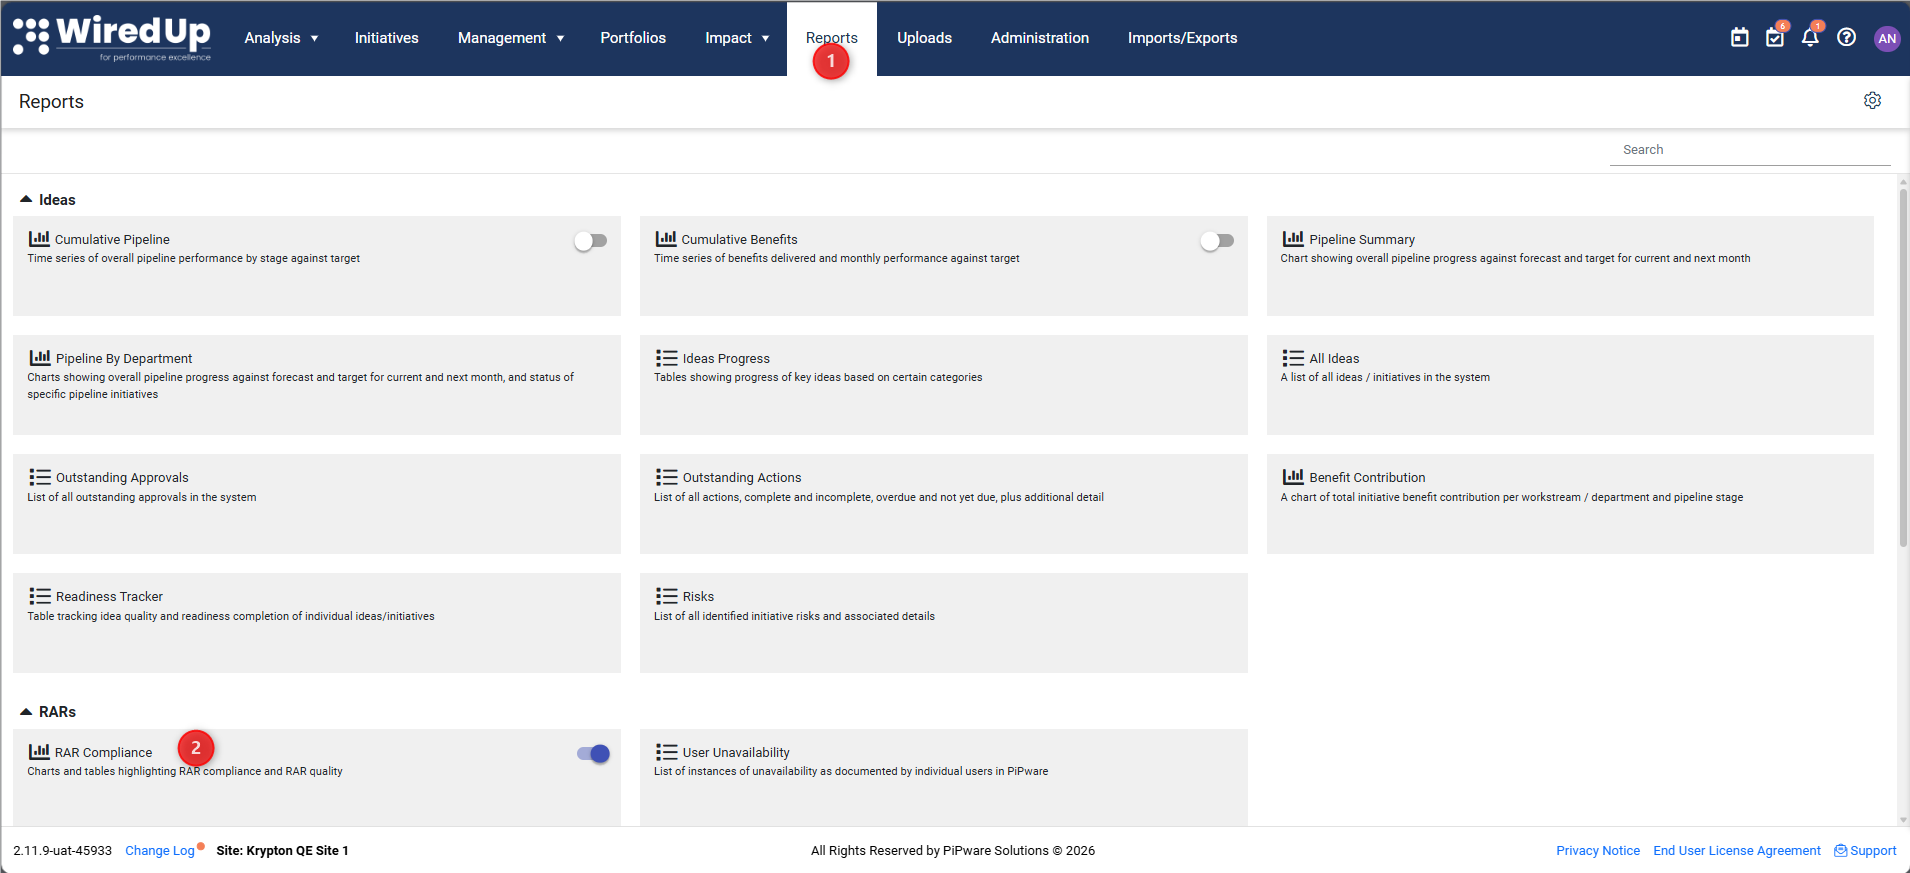
- Navigate to Reports in the main menu
- Select RAR Compliance
Report Filters
The RAR Compliance Report includes several filters to help you focus on specific data. Click the Filter icon in the top-right function bar to open the filter panel.
Applying and Clearing Filters
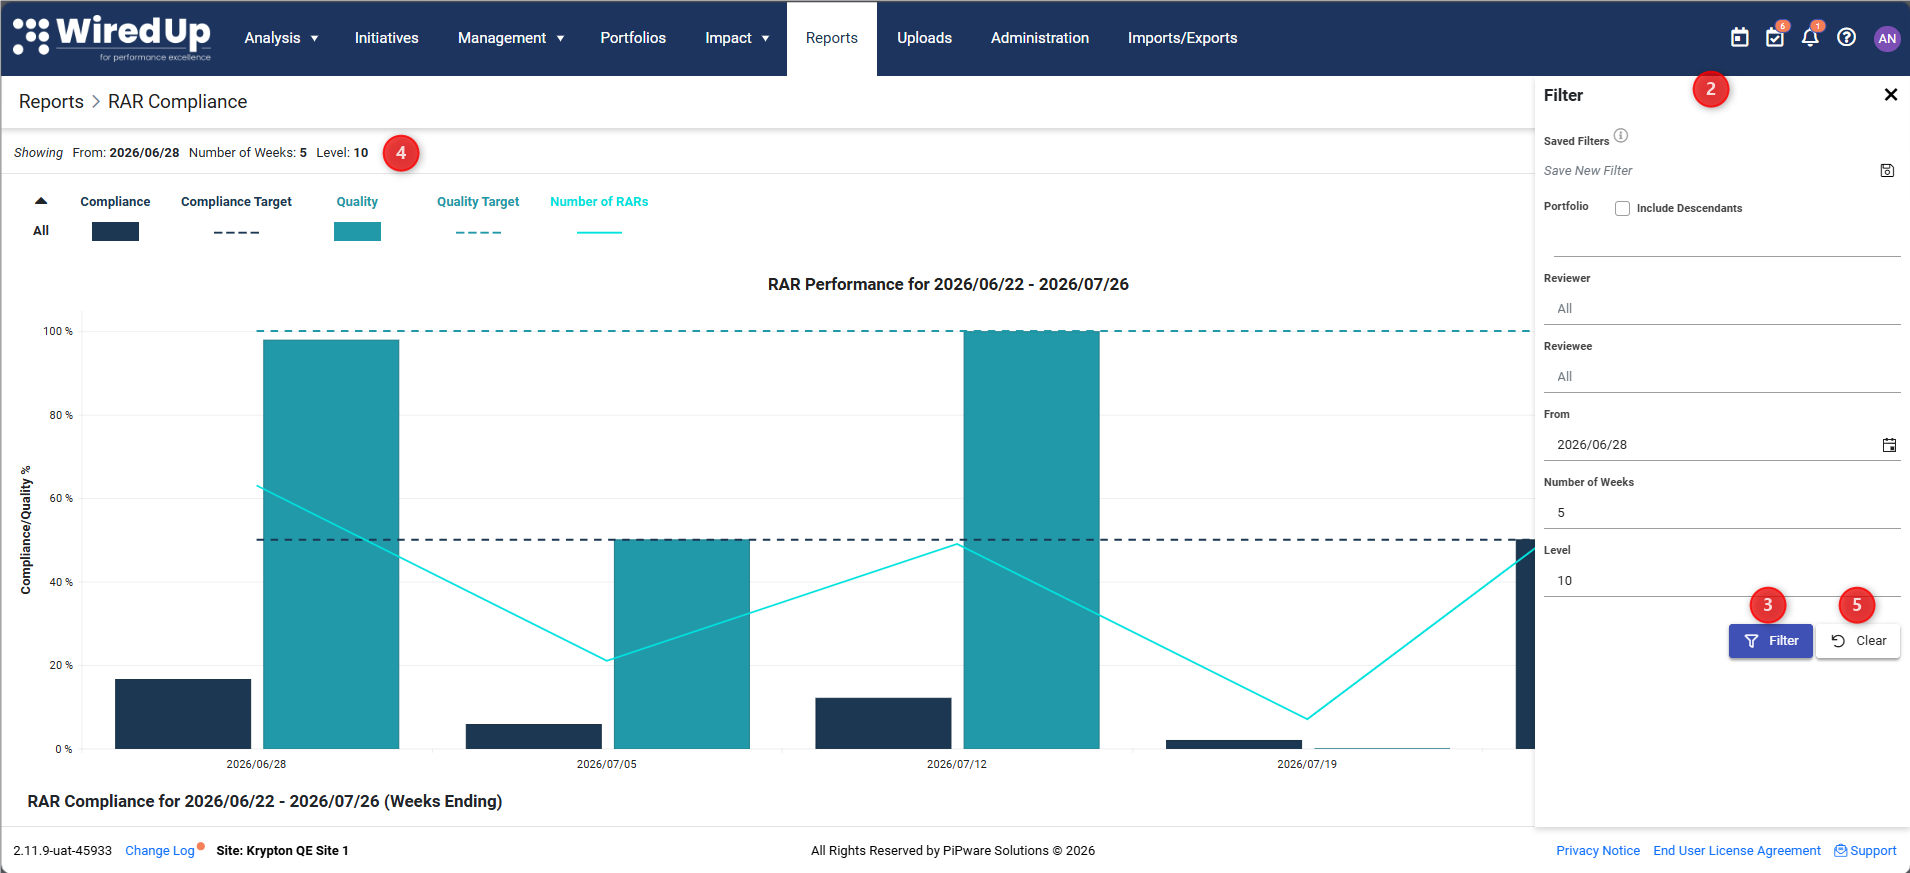
- Click the Filter icon in the function bar to open the filter panel
- Select your desired filter criteria
- Click the Filter button to apply your selections
- Applied filters will display in the "Showing" area at the top of the chart
- Click Clear to remove all applied filters
Available Filters
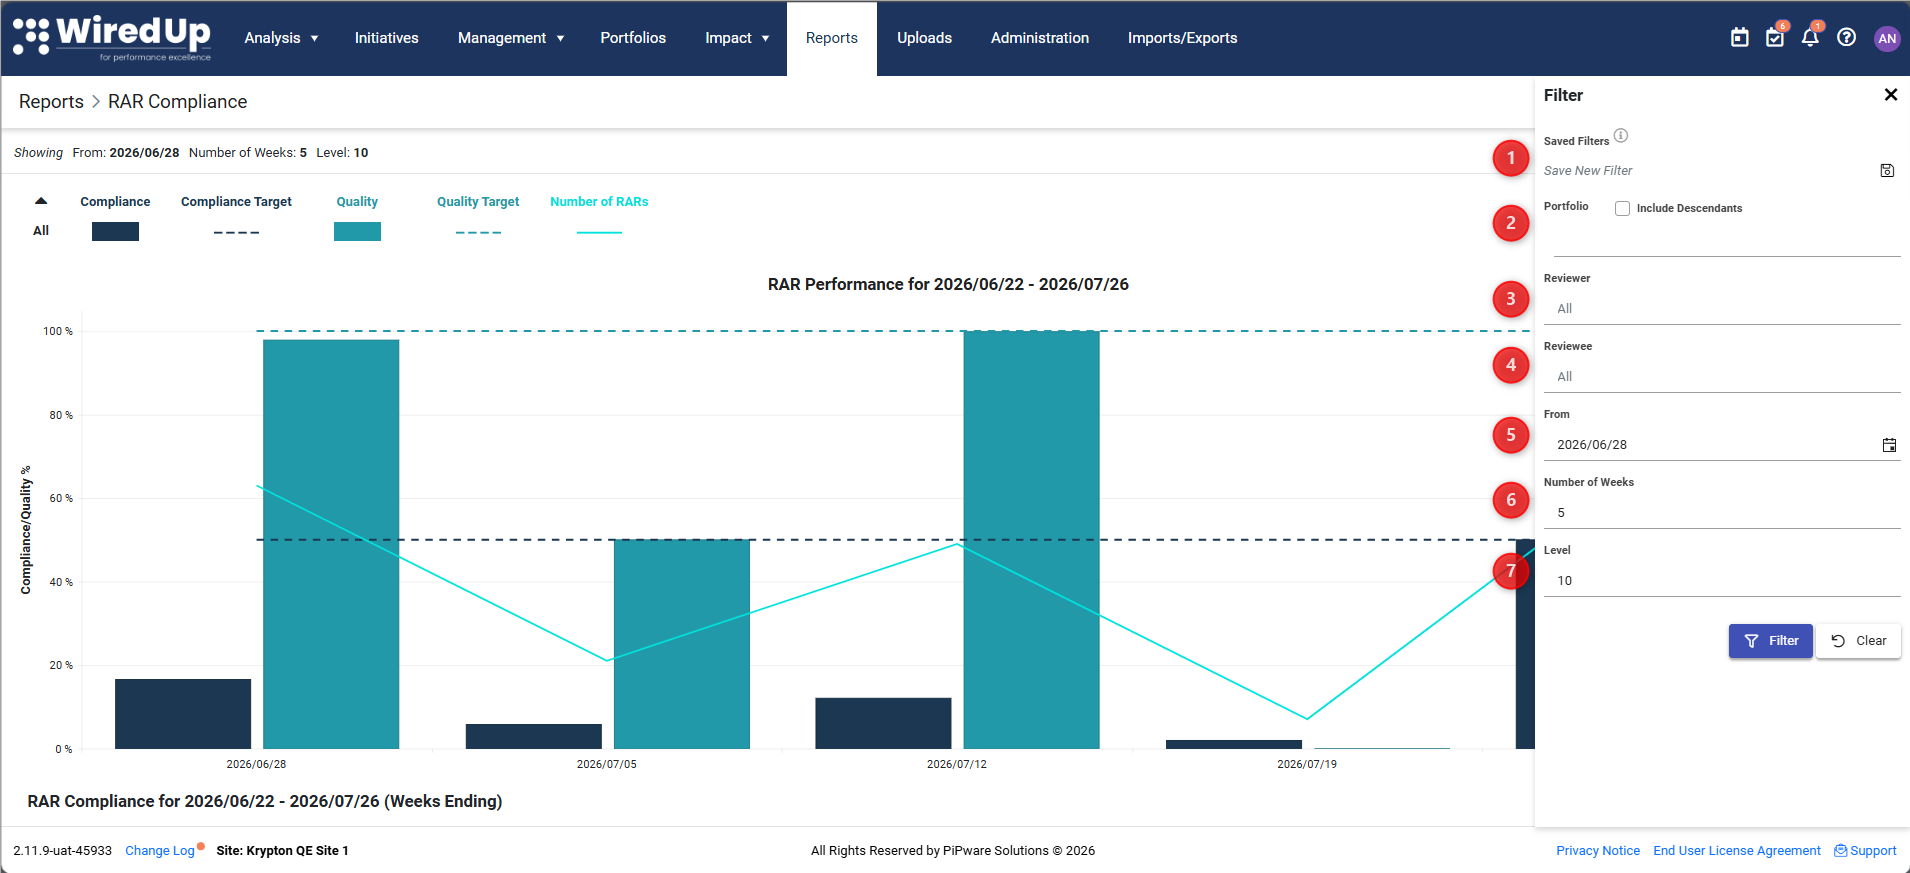
- Saved Filters: Access previously saved filter configurations from the dropdown. You can also save your current filter selection as a new saved filter for quick access in the future. For more information, please see this article: Saving Filters : WiredUp
- Portfolio: Filter by specific portfolio (with option to include descendants)
- Reviewer: Select the specific reviewer whose data you want to view. The displayed Reviewer list contains only the users that you review. To see all Reviewers, you need to be a RAR Administrator
- Reviewee: Filter by specific reviewee to narrow down the data
- From: Set the start date for the reporting period (displayed as "From: 2026/06/28" in the showing area)
- Number of Weeks: Specify how many weeks the report should cover (e.g., 5 weeks)
- Level: Determine the hierarchy depth to which the report breaks down (e.g., Level: 10). Enter a number to break down only to that level of direct reviewees, or leave blank to show all sub-reviewees by default
RAR Performance Chart
At the top of the report, you'll see a summary bar displaying key metrics:
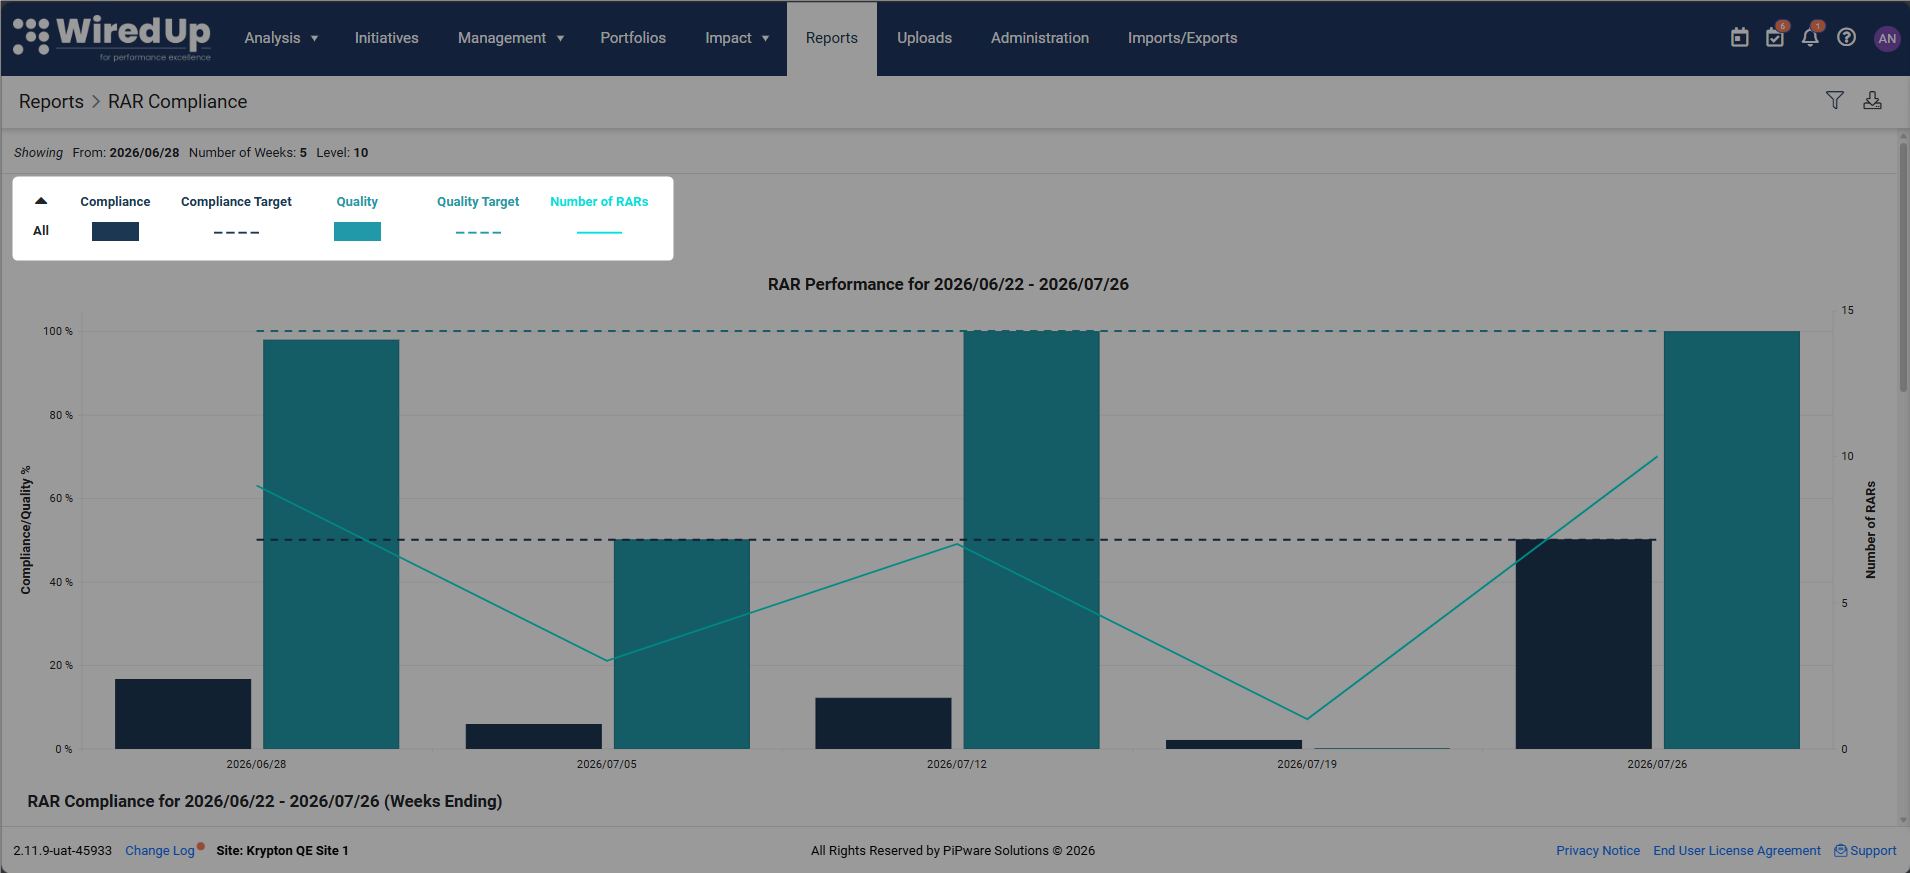
- Compliance: Current compliance percentage (shown in dark blue)
- Compliance Target: The target compliance percentage set in Admin > RAR Targets (shown as dashed line)
- Quality: Current quality percentage (shown in teal/cyan)
- Quality Target: The target quality percentage set in Admin > RAR Targets (shown as dashed line)
- Number of RARs: Total count of RARs conducted in the selected period
These metrics provide an at-a-glance view of overall performance against targets.
The RAR Performance Chart provides a visual representation of compliance and quality data over time. The chart displays:
Chart Elements
- X-Axis: Weekly periods (dates represent the week ending, e.g., 2026/06/28, 2026/07/05)
- Left Y-Axis: Compliance/Quality percentage (0% to 100%)
- Right Y-Axis: Number of RARs (count scale, e.g., 0 to 15)
- Dark Blue Bars: Compliance percentage for each week
- Teal/Cyan Bars: Quality percentage for each week
- Horizontal Dark Blue Dashed Line: Compliance target line
- Horizontal Teal Line: Quality target line
- Cyan Line Graph: Number of RARs trend line showing the count of RARs conducted over time
Interpreting the Chart
- Bars reaching or exceeding the target line indicate good performance
- Bars below the target line highlight periods requiring attention
- The trend line helps you identify patterns in RAR activity over time
- Compare the height of compliance and quality bars to quickly spot discrepancies between the two metrics
RAR Compliance Report Table
The RAR Compliance Table provides detailed compliance data broken down by reviewer or sub-department.
Table Structure
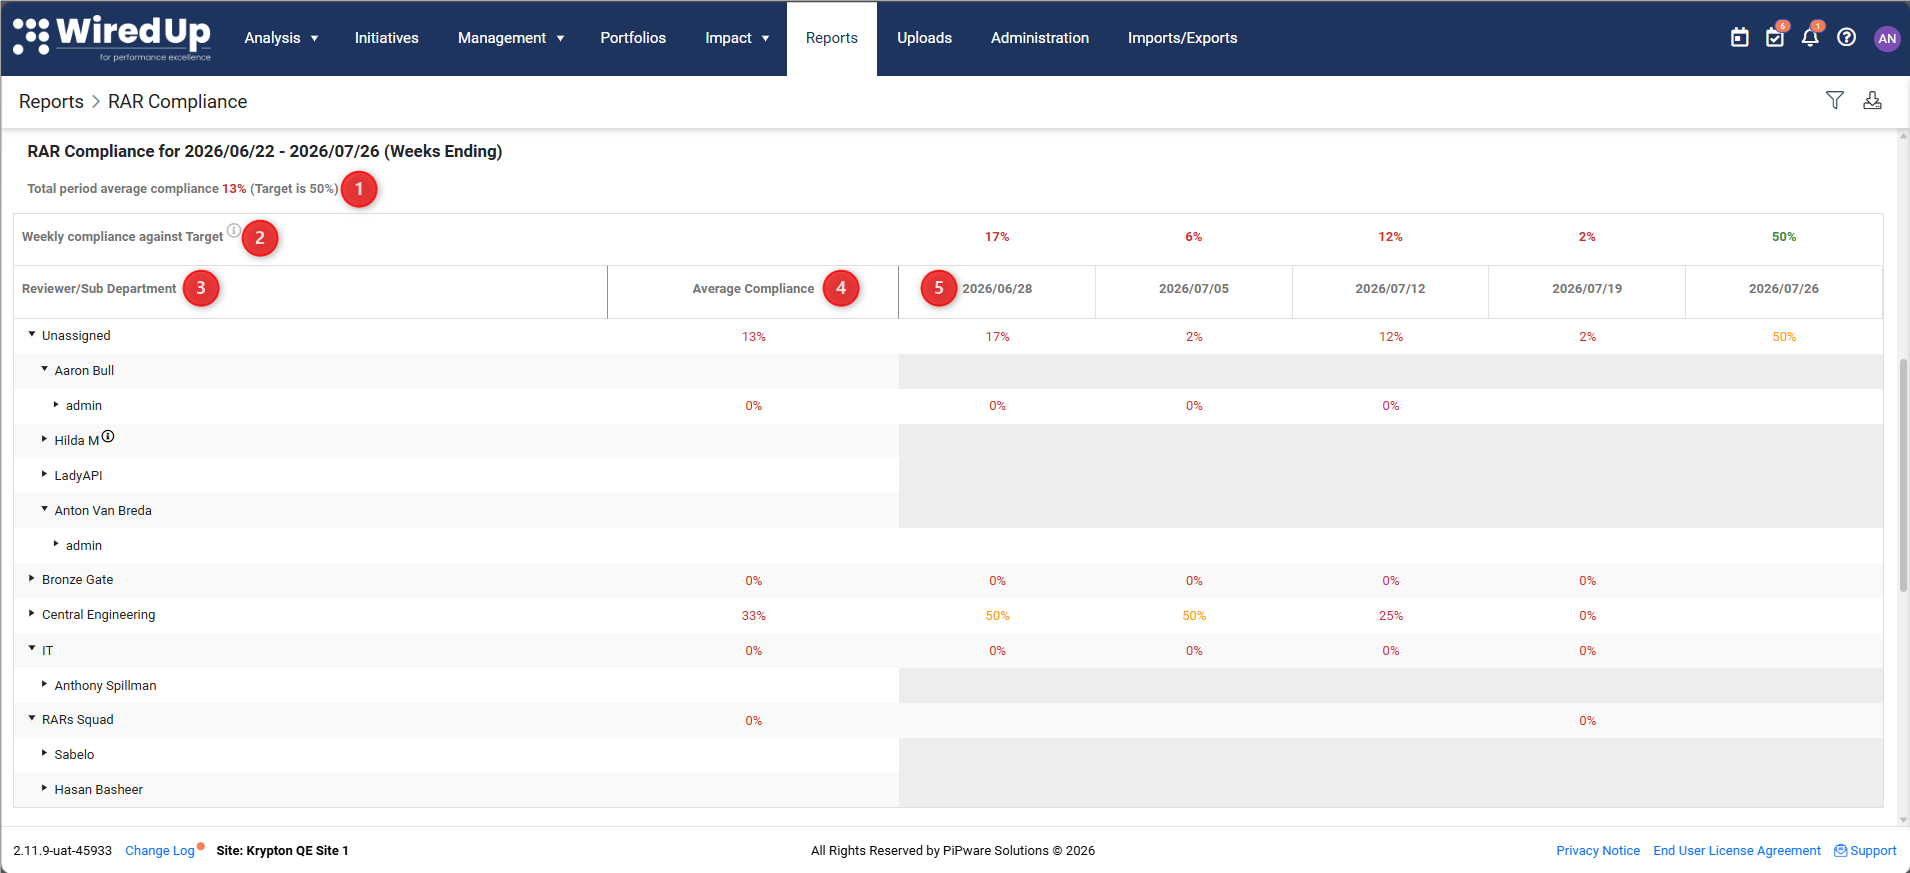
- Total Period Average Compliance: Displays at the top (e.g., "14% (Target is 50%)"), showing overall compliance against the target
- Weekly Compliance Against Target: Shows the compliance percentage for each week in the header row
- Reviewer/Sub Department Column: Lists reviewers or sub-departments (expandable with arrow icons to show hierarchy)
- Average Compliance Column: Shows the average compliance across all selected periods for each reviewee
- Weekly Columns: Individual compliance percentages for each week ending date (e.g., 2026/06/28, 2026/07/05)
Color Coding
- Red Text: Indicates compliance below target
- Orange Text: Indicates compliance approaching target
- Green Text: Indicates compliance meeting or exceeding target
For more information on how these values are calculated, please see this article: RAR compliance and quality and how are they calculated : WiredUp
The RAR Compliance table can be viewed at either Reviewer or Sub Department hierarchy breakdown. Click the arrow icon (▶) next to a reviewer or department name to expand and view sub-levels. Use the Level filter to control how many hierarchy levels are displayed.
RAR Quality Report Table
The RAR Quality Table displays quality metrics based on review questions answered during RAR sessions.
Table Structure
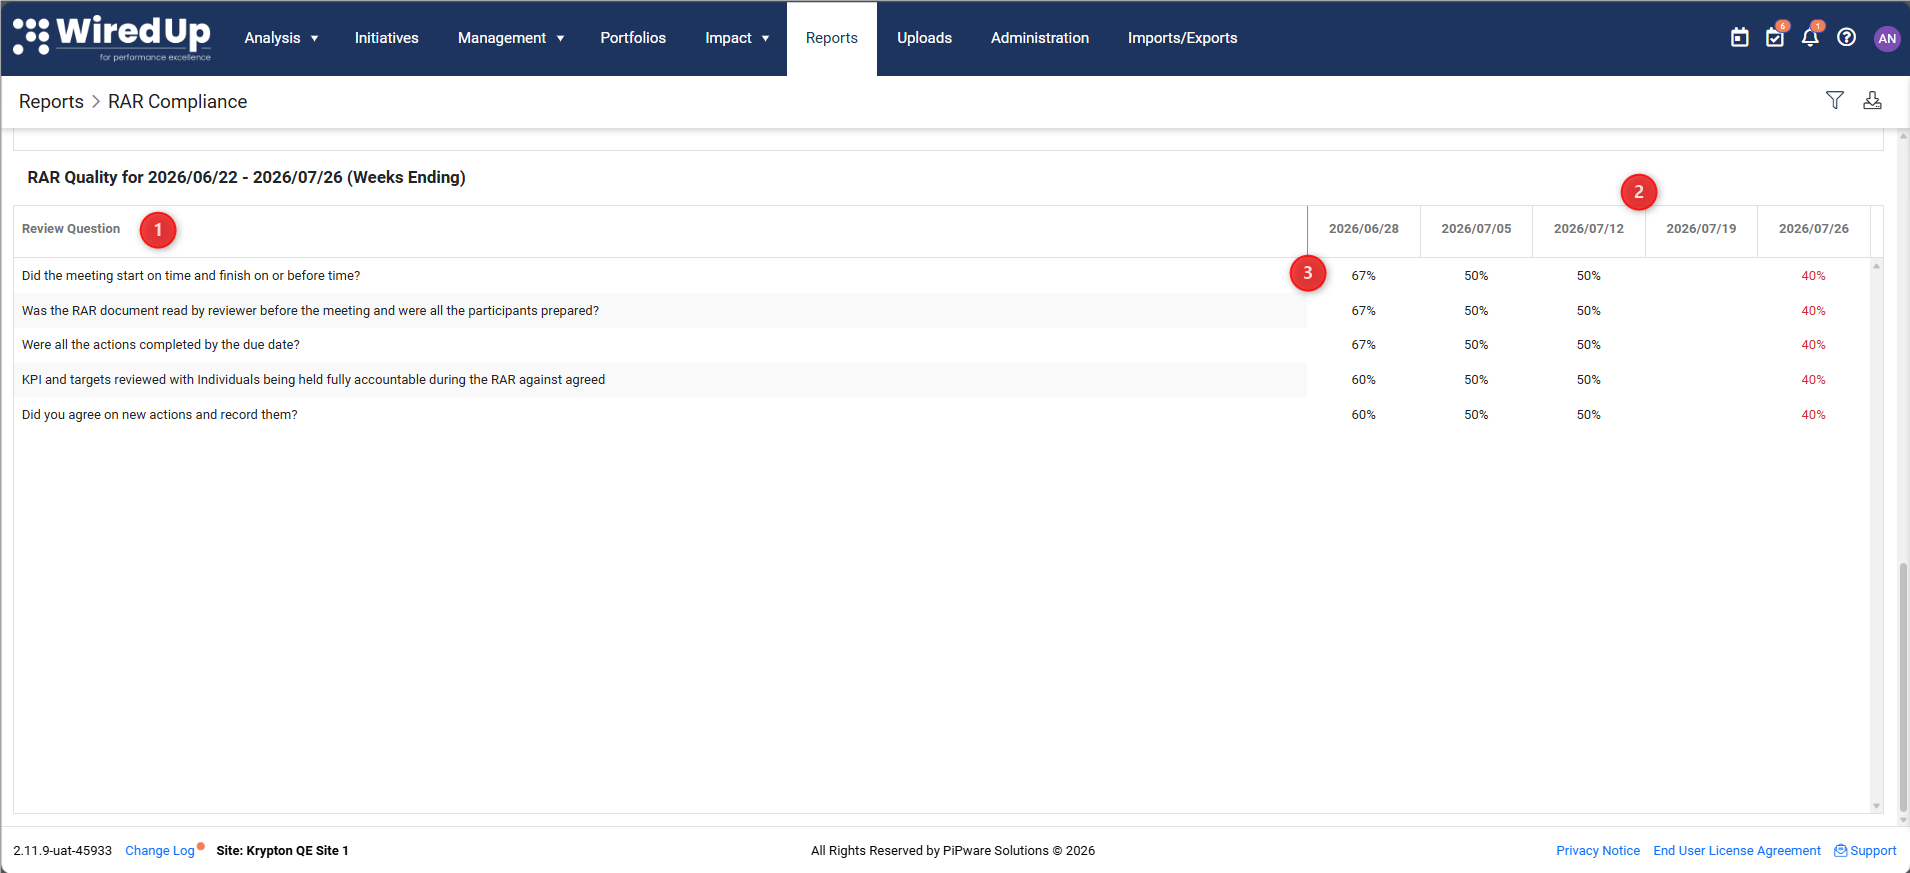
- Review Question Column: Lists each quality question used in RAR assessments
- Weekly Columns: Shows the quality score percentage for each week ending date
- Quality scores represent the percentage of "Yes" or positive responses to each review question
Interpreting Quality Scores
- Higher percentages (closer to 100%) indicate better quality
- Lower percentages highlight areas where review quality needs improvement
- Compare scores across weeks to identify trends
- Use this data to provide targeted coaching to reviewers
Exporting the RAR Compliance Report
You can download the RAR Compliance Report in either PDF or Excel format to suit your needs.
To export the report:
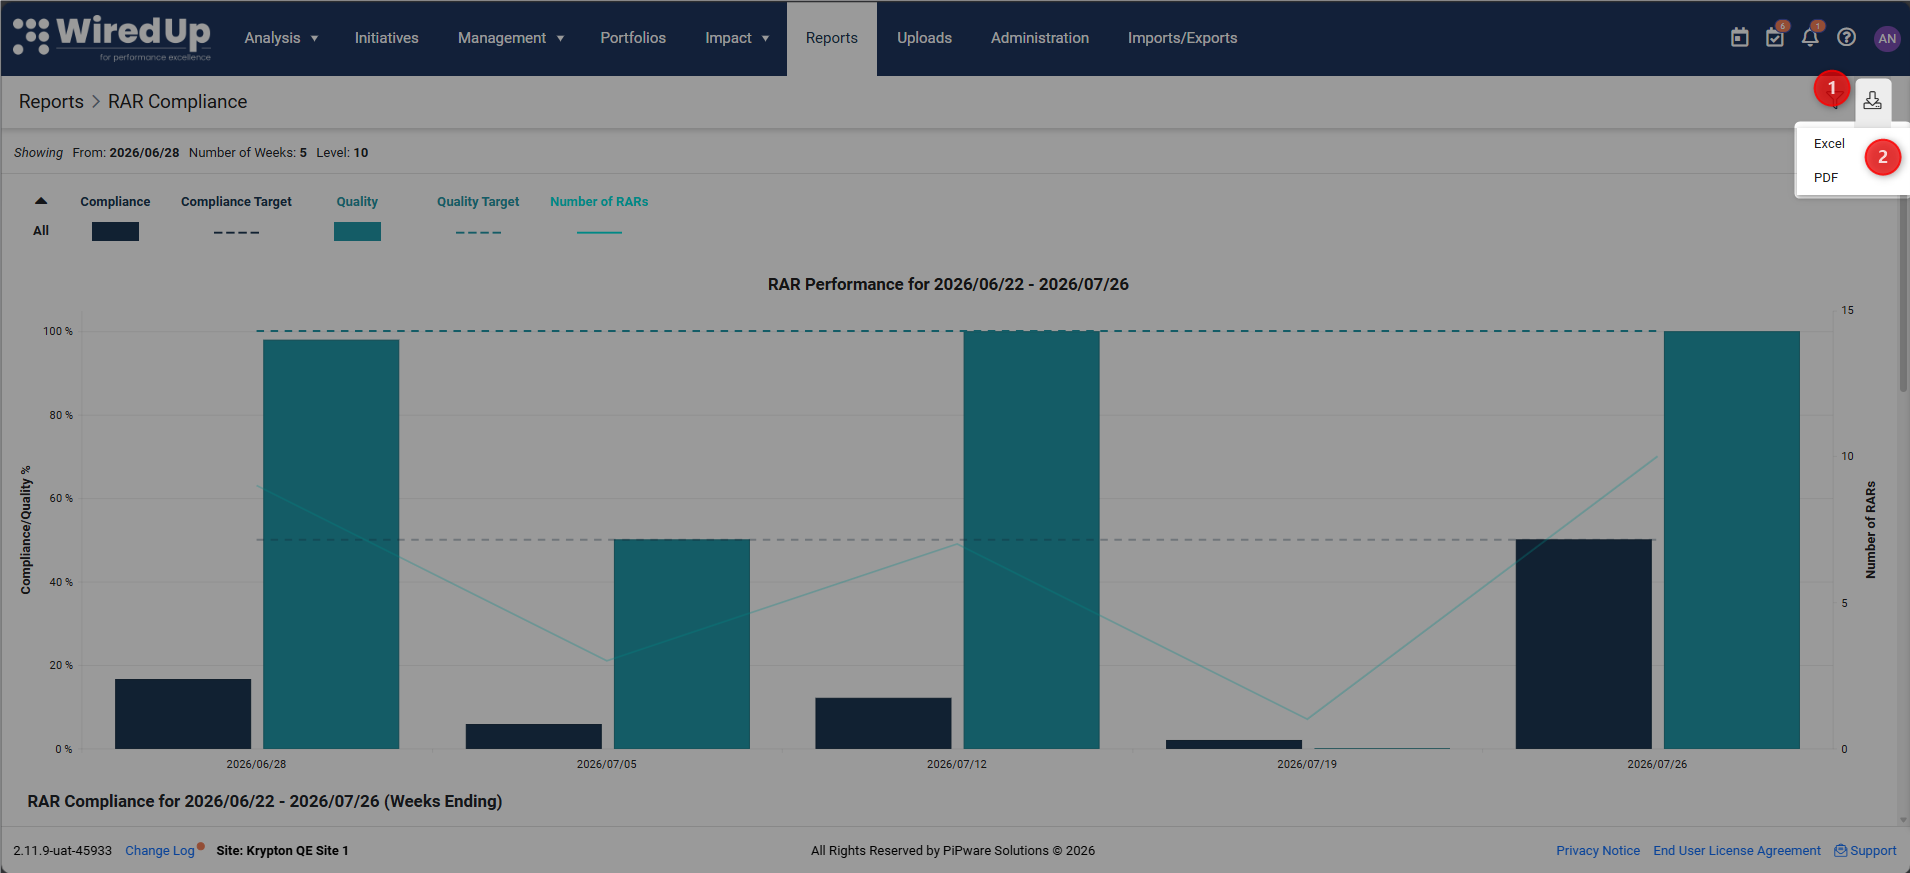
1. Click the Download icon in the top-right function bar
2. Select your preferred format:
- Excel
Excel Export Details
The Excel export includes both the RAR Compliance and RAR Quality Report sheets, with all data reflecting your current filters and selected period range.
- The download processes in the background, allowing you to continue working while the file is being prepared
- You'll receive a notification when your download is ready
- All exported data maintains accurate formatting for dates, currency, and numbers based on your site settings, ensuring consistency with what you see on screen
PDF Export
The PDF export provides a formatted version of the currently displayed report view, maintaining your selected filters and hierarchy breakdown.
Related Articles
Creating a new RAR series : WiredUp
RAR compliance and quality and how are they calculated : WiredUp