
In This Article
What are Performance Floor and Ceiling?
Configuring Performance Floor and Ceiling
Performance Floor and Ceiling on KPI Charts
How Performance Floor and Ceiling Affects Value Hound Analysis
Overview
KPI Performance Floor and Ceiling is a configuration feature that allows you to define the minimum (Floor) and maximum (Ceiling) achievable values for a KPI. When configured, these bounds ensure that Value Hound analysis calculations remain within realistic performance ranges and provide visual reference lines on KPI charts across the platform.
This feature helps prevent misleading analysis results by constraining calculations to what is realistically achievable for a given KPI. For example, if a piece of equipment has a maximum achievable availability of 95% and a minimum sustained performance of 80%, the Sensitivity Analysis will not evaluate beyond these bounds.
Key Benefits:
- Constrains Value Hound analysis calculations (Sensitivity, Attribution, Variance) to realistic performance ranges
- Displays visual reference lines on all KPI Charts across the platform
- Prevents misleading upside/downside analysis results
- Helps identify when KPI performance falls outside acceptable boundaries
What are Performance Floor and Ceiling?
- Performance Floor: The minimum acceptable value for a KPI. Value Hound analysis calculations will not evaluate below this value.
- Performance Ceiling: The maximum achievable value for a KPI. Value Hound analysis calculations will not evaluate above this value.
- Capping: The process of constraining KPI Actual values to the configured performance band in analysis calculations. When a KPI's actual value falls outside the configured band, the floor or ceiling value is used in calculations instead.
When to Use Performance Floor and Ceiling
Use Performance Floor and Ceiling when:
✅ Your KPI has physical or operational limits, such as:
- Equipment availability (e.g., maximum 95% due to planned maintenance)
- Process efficiency (e.g., minimum 80% sustained performance)
- Production capacity (e.g., maximum throughput based on equipment specifications)
- Safety metrics (e.g., minimum acceptable safety performance)
✅ You want to ensure Value Hound analysis reflects realistic scenarios rather than theoretical extremes
✅ You need visual reference lines on KPI charts to quickly identify when performance is outside acceptable boundaries
❌ Do NOT use Performance Floor and Ceiling for:
- Target or goal setting (use KPI Target values instead)
- Performance ranges for status colors
- Arbitrary limits without operational justification
Configuring Performance Floor and Ceiling
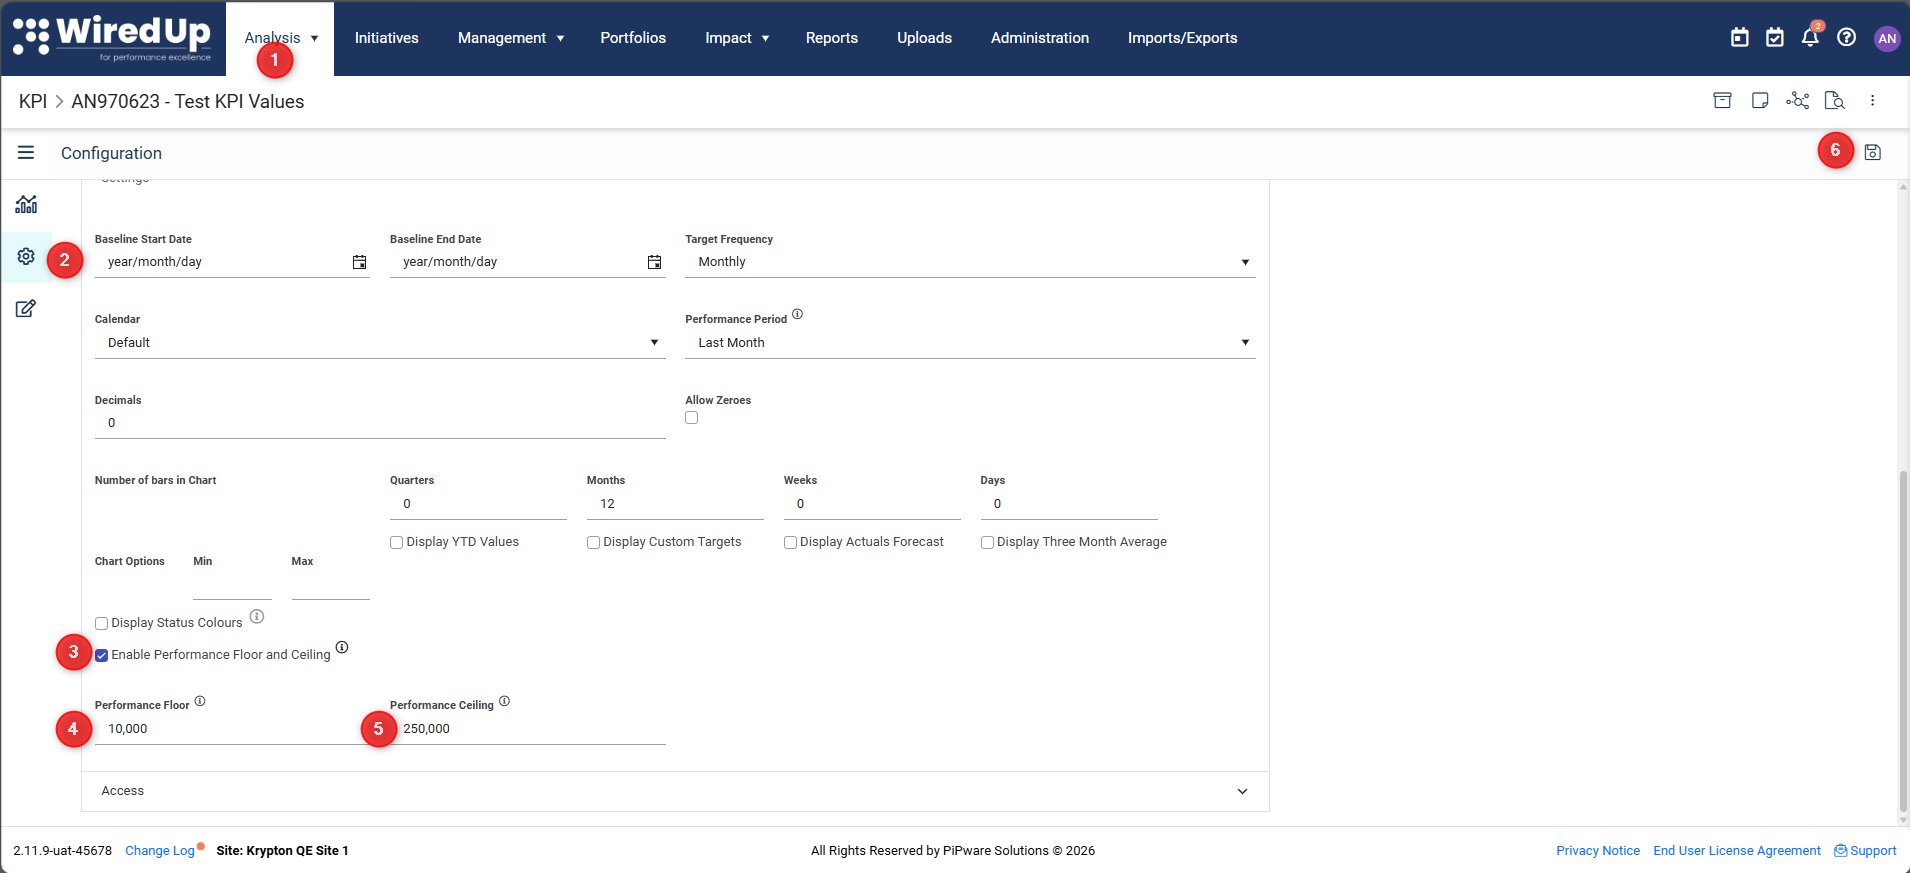
- Navigate to KPI from the main navigation and open the KPI you want to configure
- Click on the Configuration tab and scroll to the Settings section
- Locate the Enable Performance Floor and Ceiling checkbox and tick the checkbox to enable the feature
- Enter the minimum acceptable value (Performance Floor) for this KPI
- Enter the maximum achievable value (Performance Ceiling) for this KPI
- Click Save to apply your configuration
Each setting has a tooltip icon that contains additional information for each setting. Click on the 'i' icon to view the tooltip.Configuration Rules
- Both fields are optional — you can configure either the Floor, the Ceiling, or both independently
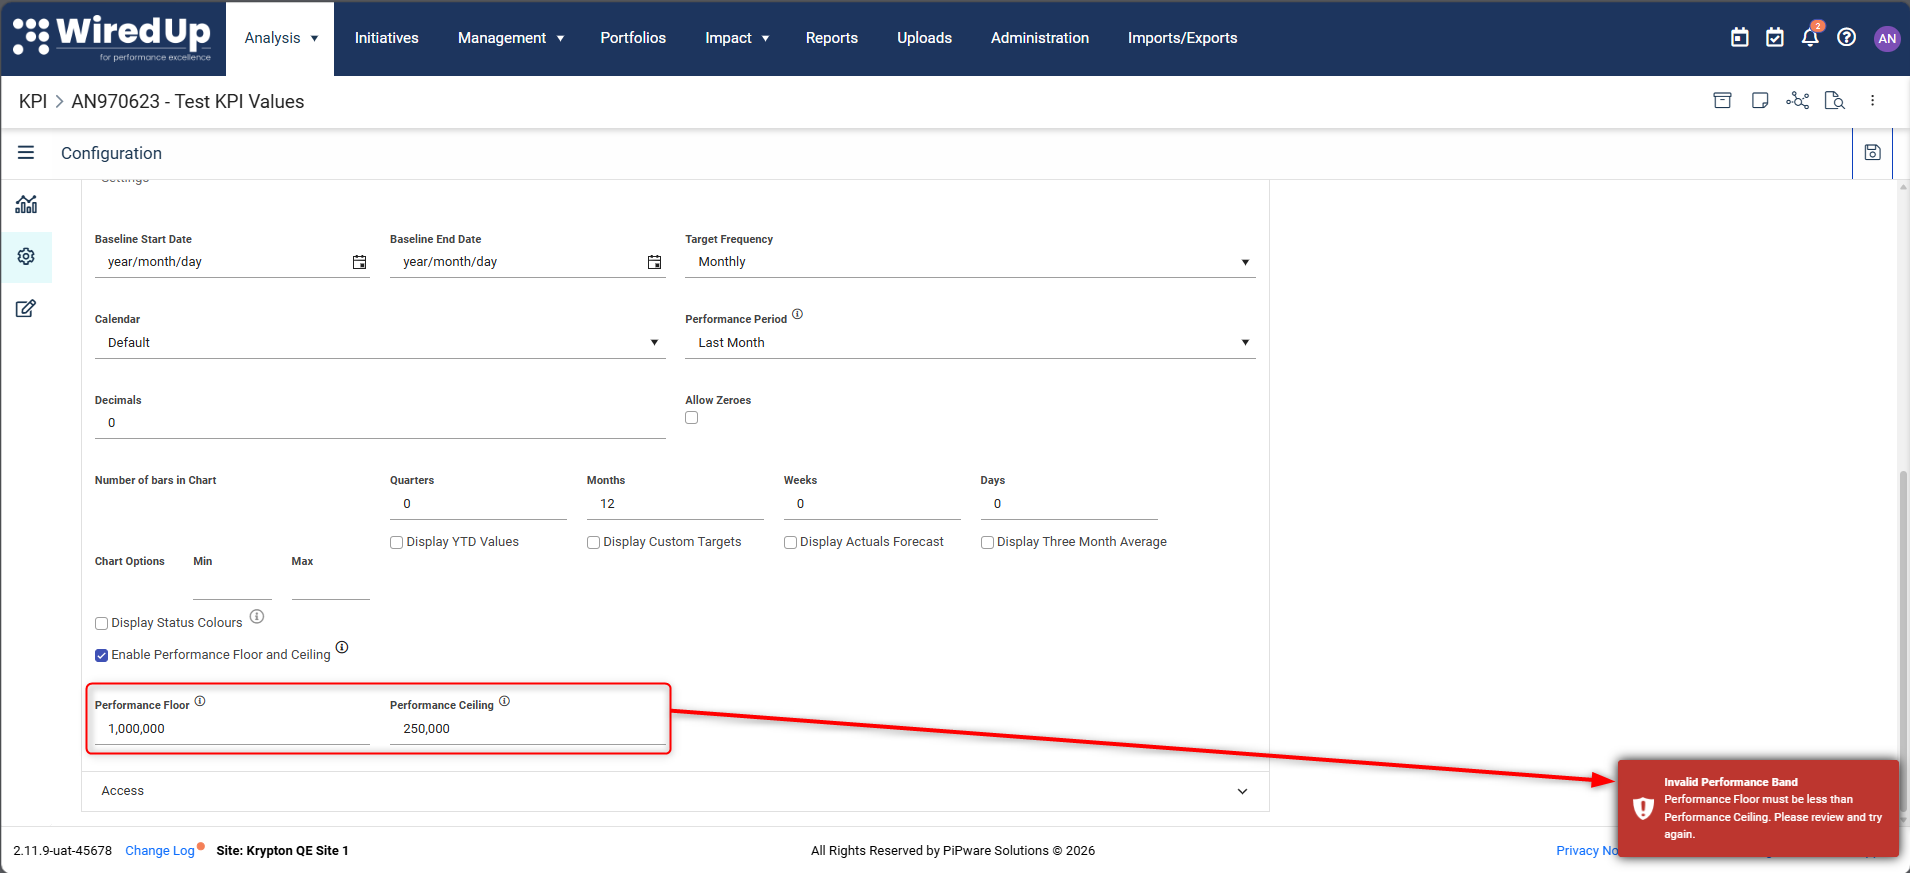
- Performance Floor must be less than Performance Ceiling — if not, you'll receive a validation error
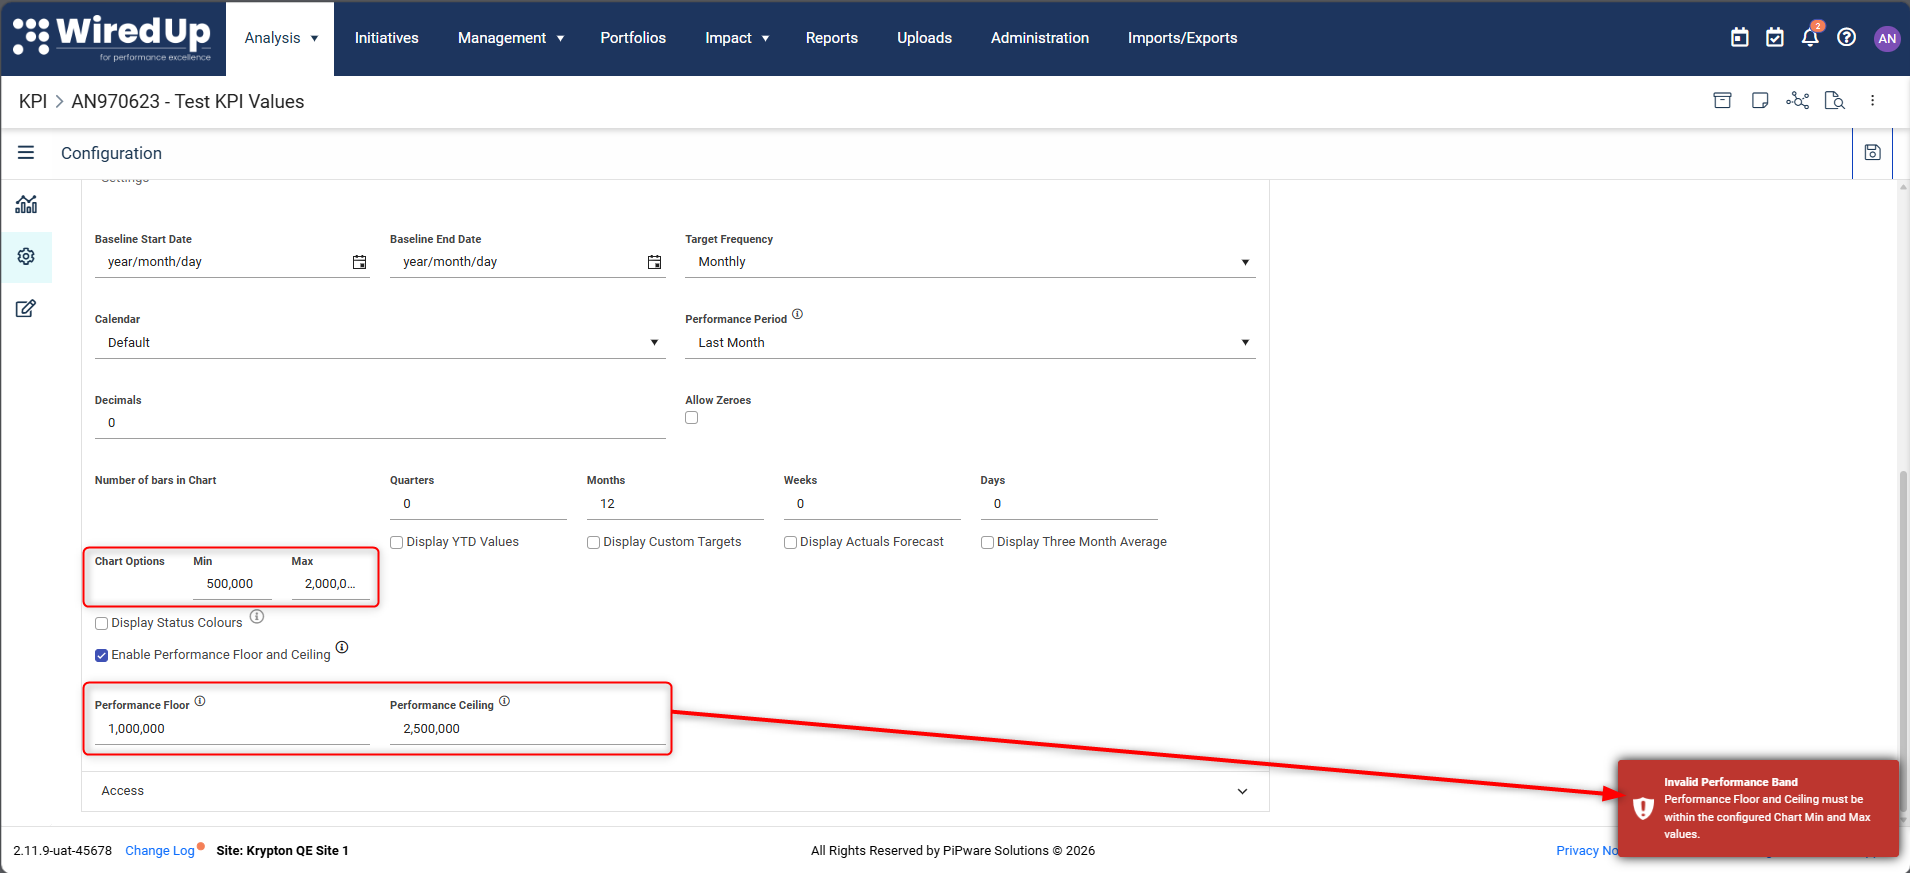
- Values must be within Chart Min and Max — if you have configured Chart Options Min/Max values, the Performance Floor cannot be below Chart Min and the Performance Ceiling cannot exceed Chart Max
- When you untick the checkbox, both fields are hidden and their values are cleared
Performance Floor and Ceiling on KPI Charts
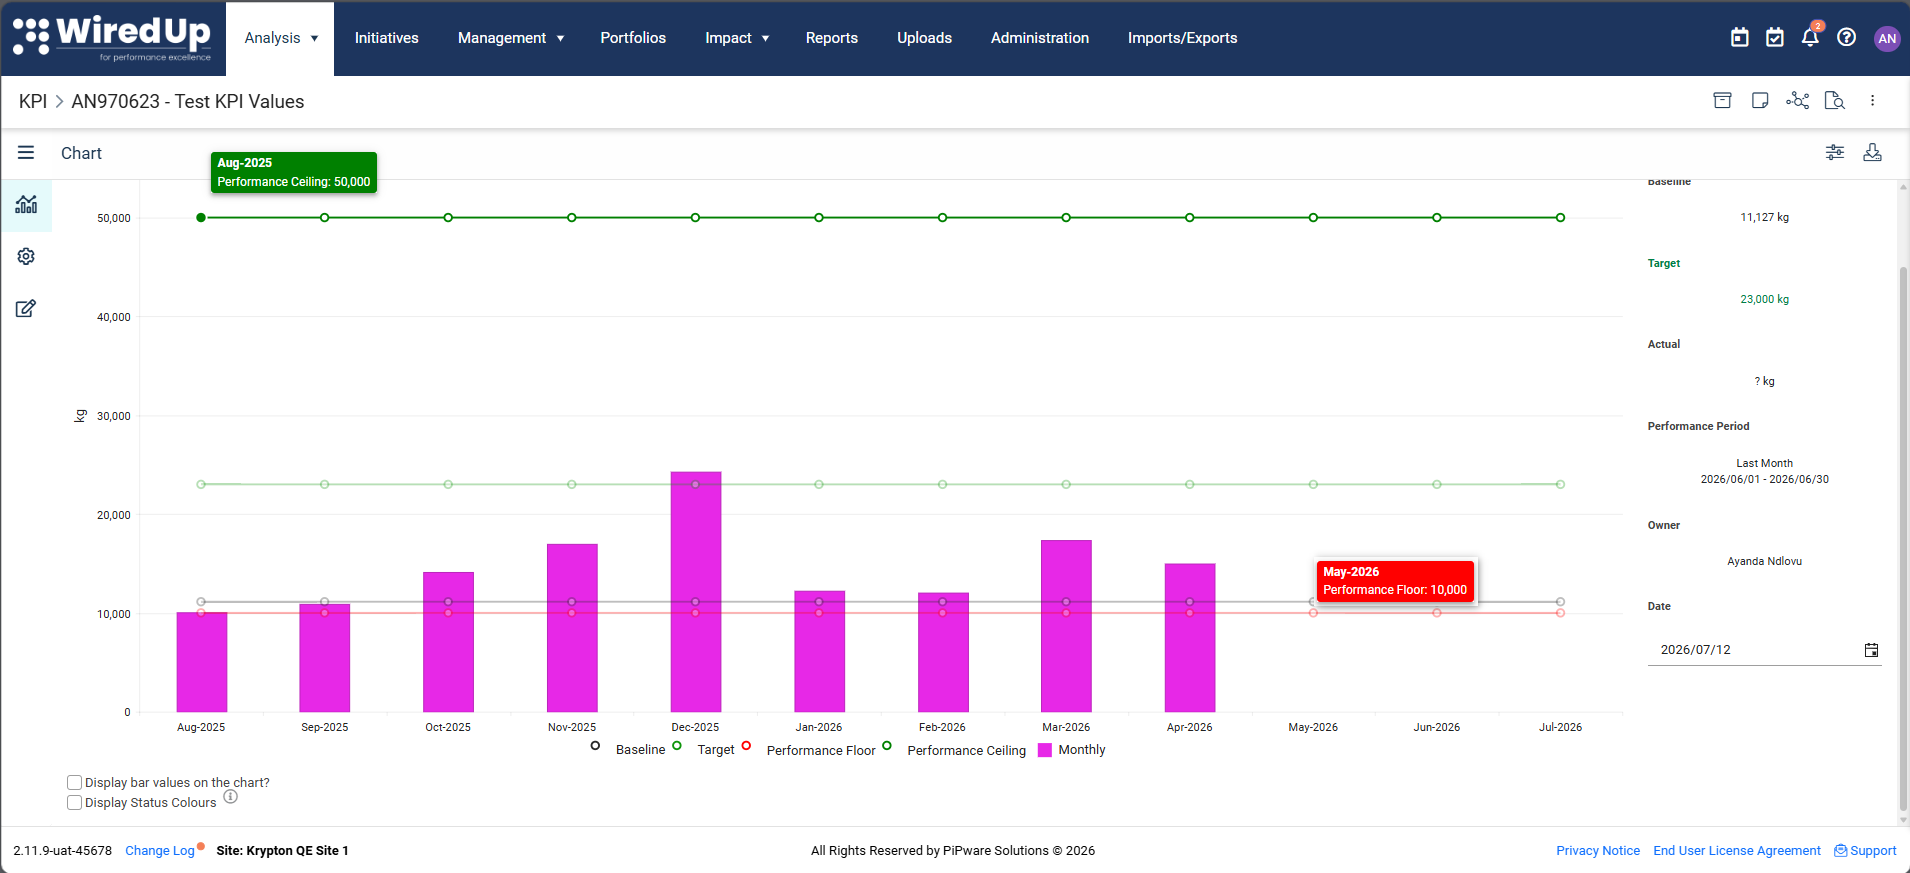
When you configure Performance Floor and Ceiling on a KPI, horizontal reference lines are automatically displayed on all KPI Charts across the platform wherever that KPI chart appears, including:
- Dashboards
- VDT nodes
- Value Hound analysis pages
- Meetings
- Risk and Review (RaR) reports
- Any other location where the KPI chart is displayed
These horizontal reference lines are configured on Administration > Settings > KPI and only appear when the Performance Floor and/or Performance Ceiling is configured.
Interactive Legend
The Performance Floor and Ceiling lines are included in the KPI Chart's interactive legend:
- Legend entries are labeled Performance Floor and Performance Ceiling
- Click a legend entry to toggle the corresponding line visibility on/off
- Legend entries only appear when the respective floor/ceiling value is configured
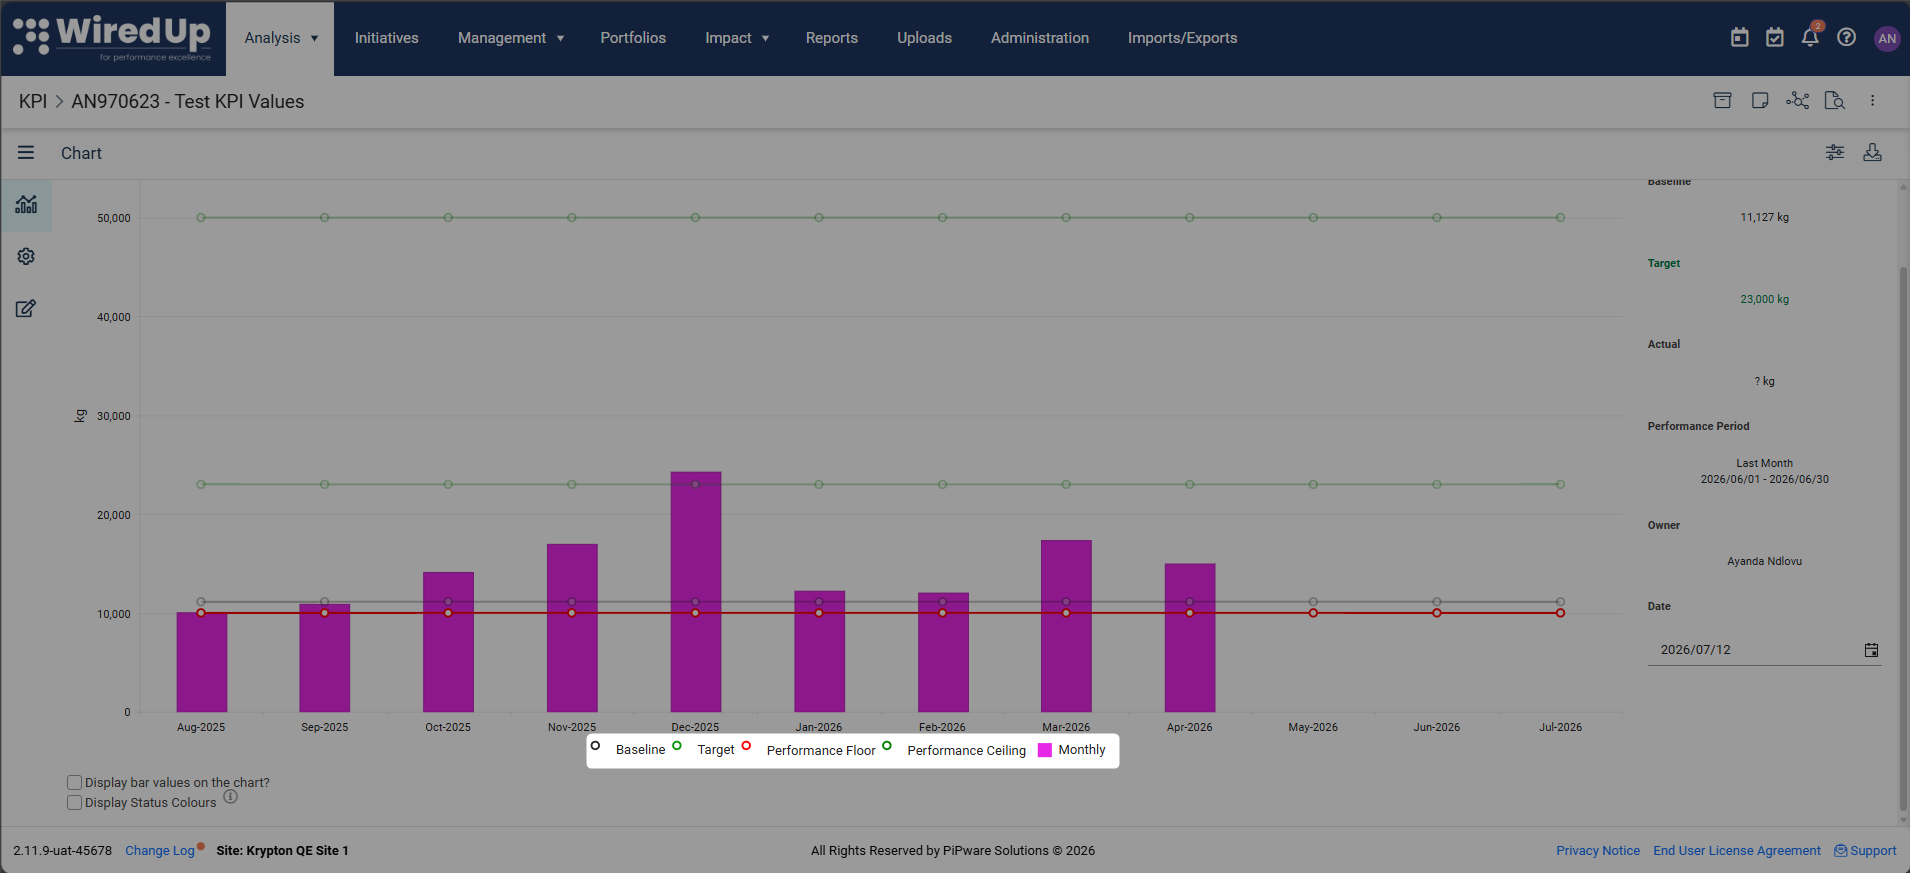
Note: Performance Floor and Ceiling lines do not appear on Sensitivity, Attribution, or Variance Analysis charts. However, the capping behavior still applies to the calculations. You can access the KPI Chart from these analysis pages to view the reference lines.How Performance Floor and Ceiling Affects Value Hound Analysis
When a KPI has Performance Floor and/or Performance Ceiling configured, the KPI's Actual value is capped within the performance band before being used in Value Hound analysis calculations.
Important Rules
- Capping applies to Actual values only — Target and Baseline values are never capped
- Capping only occurs when the analysis Field is set to Actual — no capping occurs when analyzing Target or Baseline
- Capping is automatic — you don't need to do anything special; the system applies capping whenever the conditions are met
- Does not apply to KPIs without Performance Floor and Ceiling configured
How Capping Works
When a KPI Actual value falls outside the configured performance band:
- If the Actual value exceeds the Performance Ceiling, the ceiling value is used in the calculation
- If the Actual value falls below the Performance Floor, the floor value is used in the calculation
- If the Actual value is within the band, the actual value is used unchanged
Sensitivity Analysis
Capping Behavior:
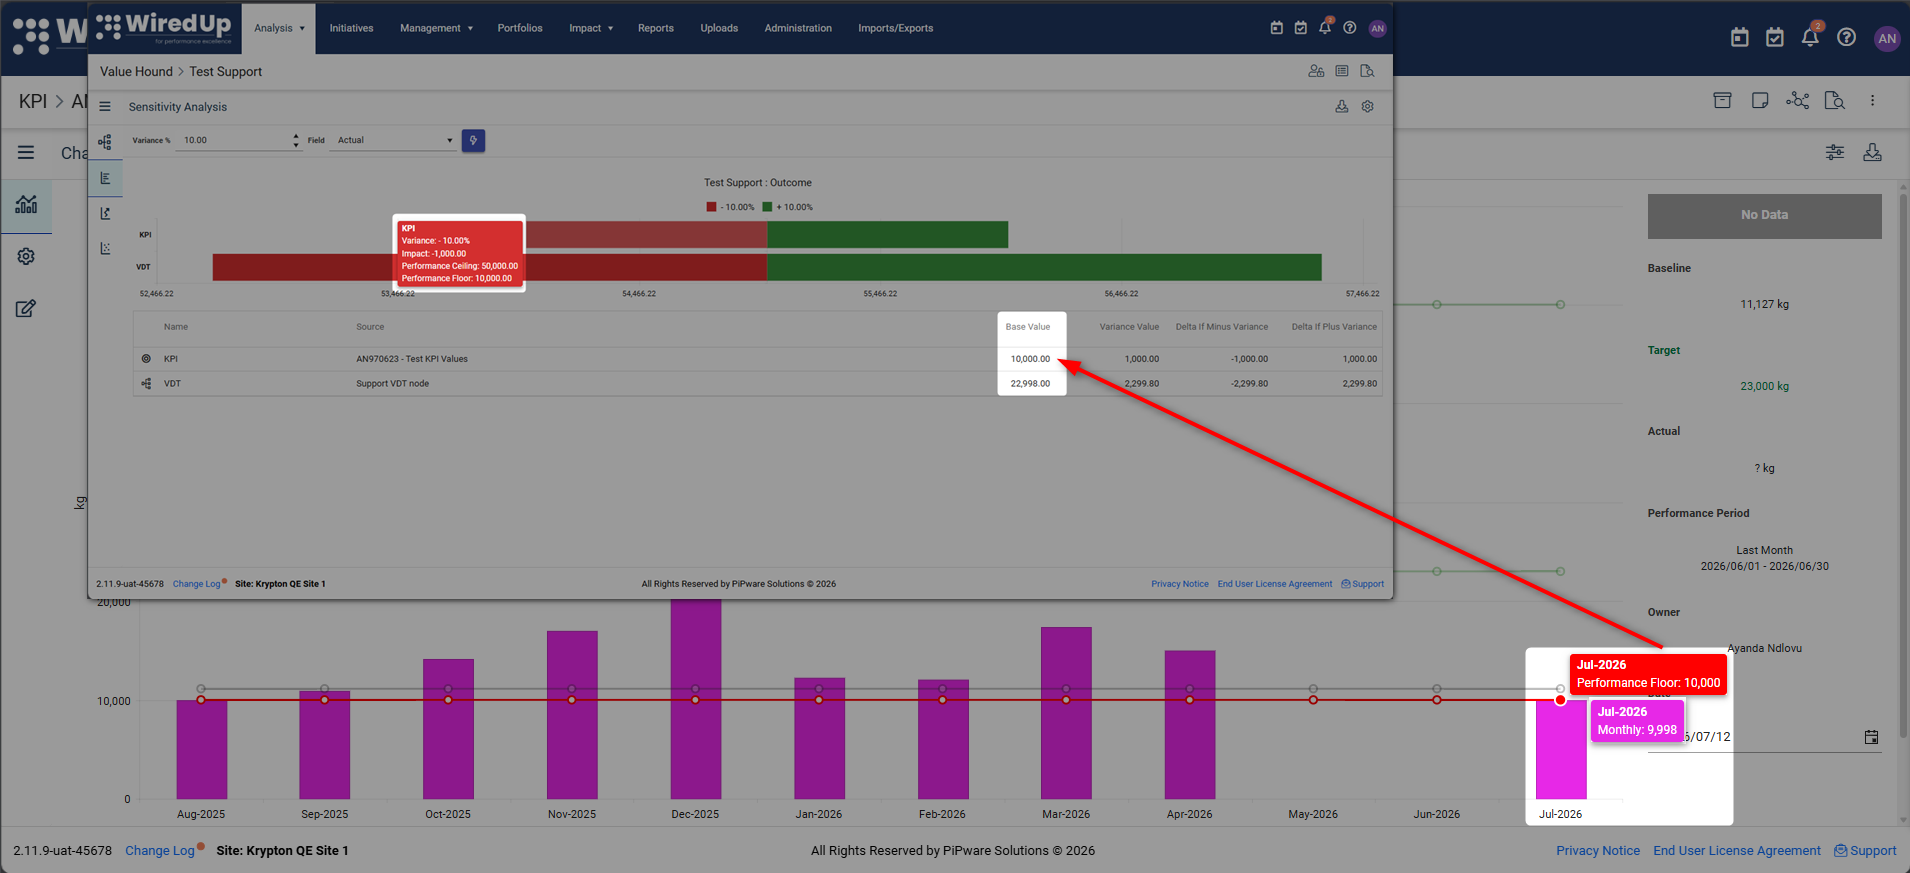
- When a KPI node has Performance Floor and/or Performance Ceiling configured, its Actual value is capped within the performance band before being used in Sensitivity Analysis calculations
- The Sensitivity Analysis chart visually reflects the capped value — the bar is cut off at the floor/ceiling boundary
- The Sensitivity Analysis table reflects the capped values in the Variance Value, Delta If Minus Variance, and Delta If Plus Variance columns
Attribution Analysis
Capping Behavior:
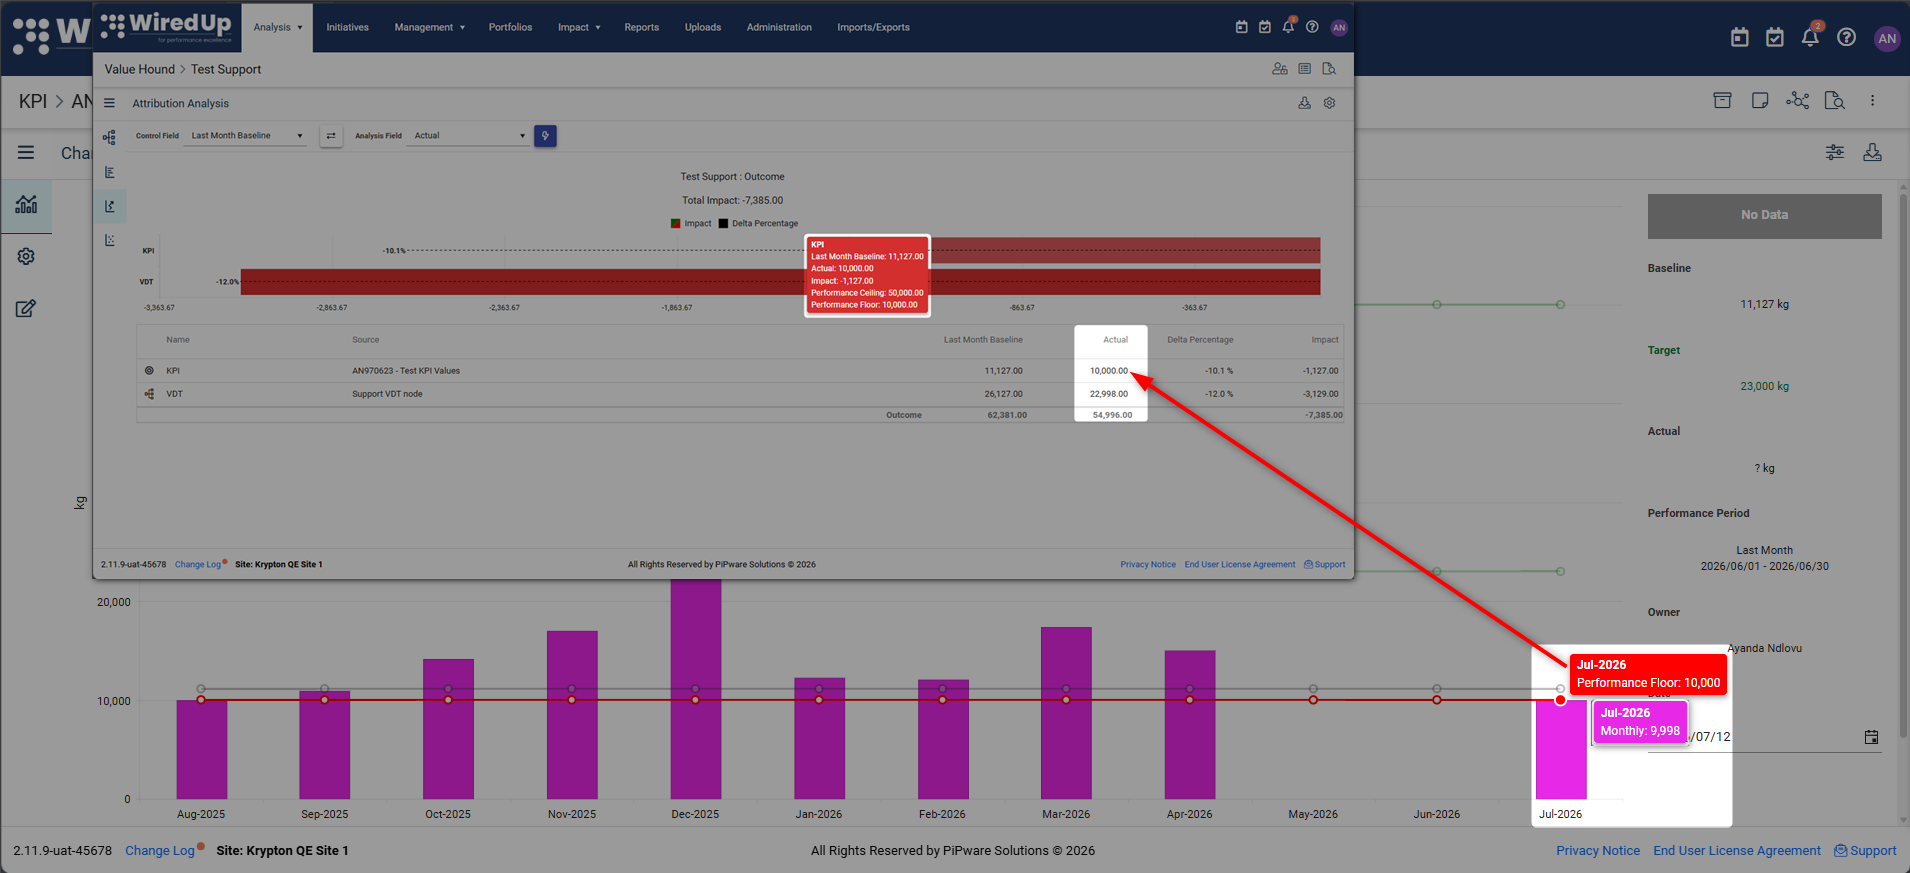
- When a KPI node has Performance Floor and/or Performance Ceiling configured, its Actual value is capped within the performance band before being used in Attribution Analysis calculations
- The Attribution Analysis chart visually reflects the capped value — the bar is cut off at the floor/ceiling boundary
- The Attribution Analysis table reflects the capped values in the Actual and Impact columns
Variance Analysis
Capping Behavior:
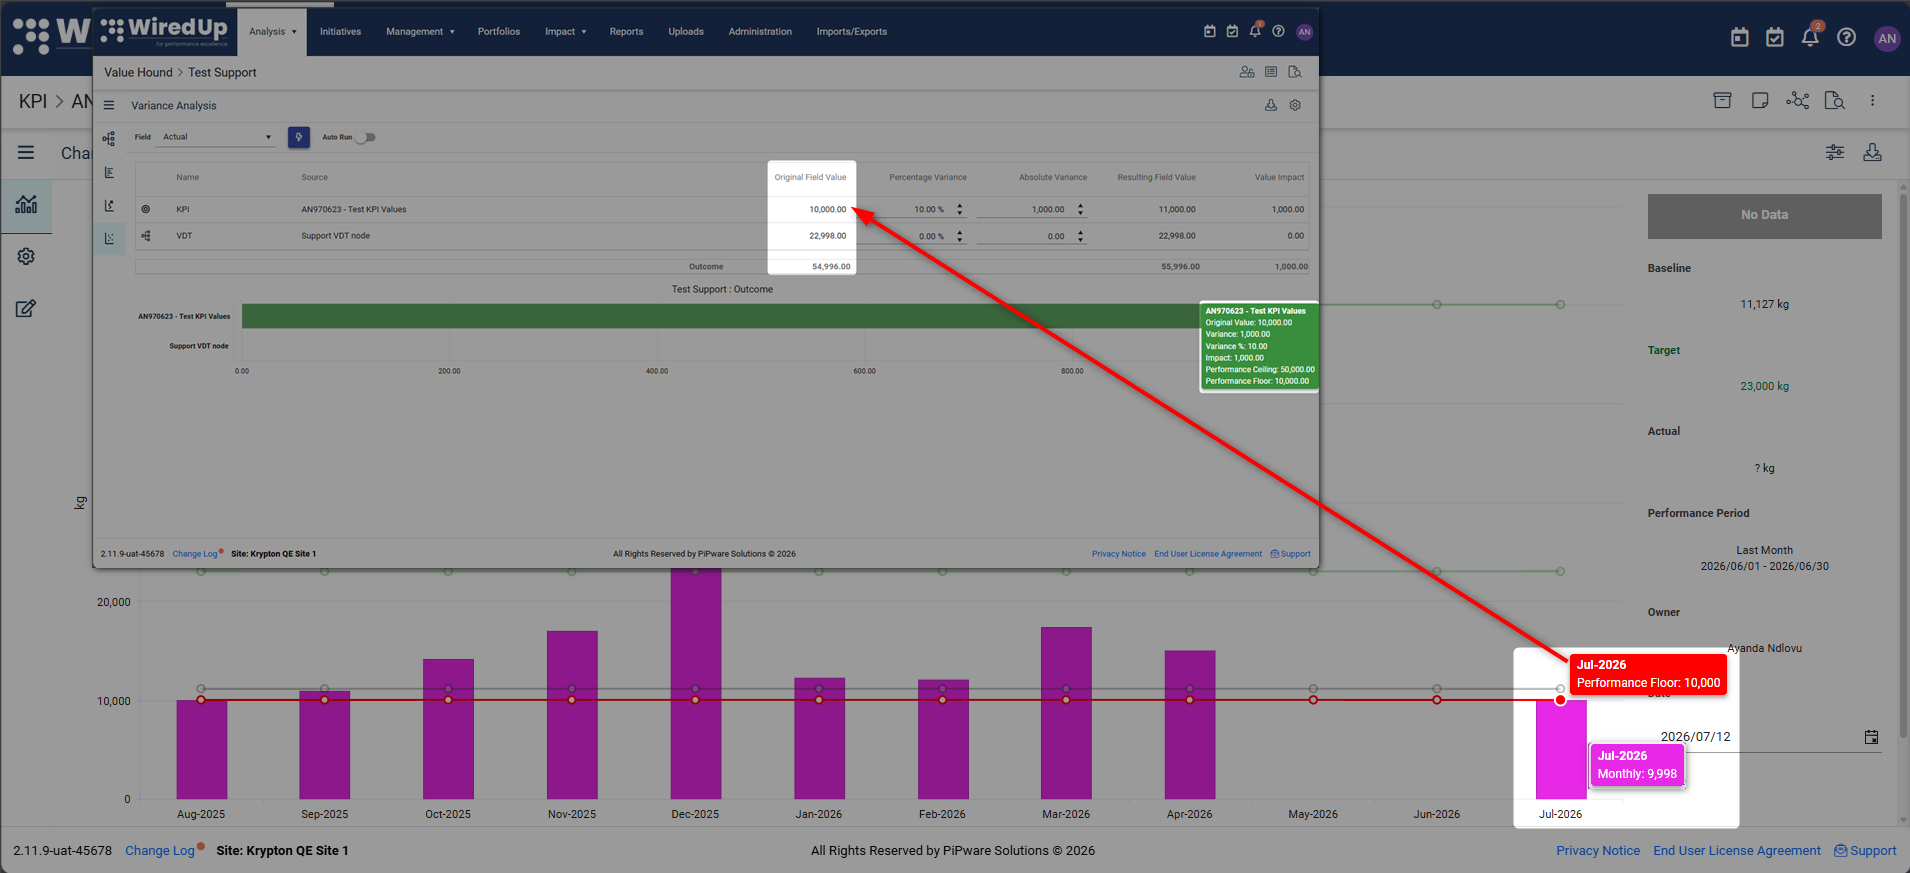
- When a KPI node has Performance Floor and/or Performance Ceiling configured, its Actual value is capped within the performance band before being used in Variance Analysis calculations
- The Variance Analysis chart visually reflects the capped value — the bar is cut off at the floor/ceiling boundary
- The Variance Analysis table reflects the capped values in the Resulting Field Value and Value Impact columns
Best Practices
- Base your Performance Floor and Ceiling on operational data and physical constraints, not aspirational goals
- Review historical performance data to understand actual achievable ranges
- Consider planned maintenance, operational constraints, and equipment specifications
- Add comments to the KPI explaining why specific floor and ceiling values were chosen
- Document the operational or physical constraints that define the boundaries
- Update the values when KPIs are upgraded or processes change
- Review Performance Floor and Ceiling values periodically (e.g., annually or when equipment changes)
- Performance Floor and Ceiling is distinct from Control Chart ranges (green/amber/red status colors)
- Performance Floor and Ceiling affects Value Hound analysis calculations; Control Chart ranges only affect visual status indicators
- You can use both features together on the same KPI for different purposes
Related Articles
Running Analysis with Value Hound : WiredUp
Value Hound Sensitivity Analysis Explained : WiredUp